Capital Markets Assumptions
Asset class forecasts to help inform our strategic asset allocations.

Key Takeaways
We expect U.S. equity price-earnings (P/E) multiples to contract over the next five years, particularly among large-cap growth stocks.
The 2025 stock/bond efficient frontier has shifted downward compared to 2024, consistent with valuation normalization and higher inflation.
We expect cash returns to stay ahead of inflation, which we expect to remain at 2.75% on average in the medium term.
Our Multi-Asset Strategies team consistently monitors the evolving investment landscape to guide our capital markets assumptions. As 2025 concludes and we transition into 2026, we find that prevailing macroeconomic data, policy developments, market pricing and earnings trends remain consistent with our current outlook, reinforcing our three- to five-year projections.
We base our analysis on valuation, income and growth fundamentals, which typically shift slowly and are not significantly impacted by short-term volatility.
Our Five-Year Return Expectations by Asset Class
Equities
We continue to expect some multiple normalization for U.S. large‑cap equities over the next five years, leaving our (arithmetic average) return forecast at 6.50%. Here is a summary of our expectations for equities, along with details of our projections in Figure 1.
U.S. Large-Cap Growth Equity
While U.S. large-cap growth stocks have been propelled higher in recent years by both earnings growth and high P/E multiples, we expect valuation multiples to decline even as earnings remain healthy.
U.S. Large-Cap Value Equity
We expect the average P/E multiple for U.S. large-cap value stocks to decline to a lesser extent. While we anticipate modest earnings growth for value stocks over the next five years, dividends are expected to support the asset class.
U.S. Small-Cap Value Equity
We expect U.S. small-cap stocks to generate earnings growth that outpaces large-cap value stocks, while their P/E multiples are expected to remain mostly unchanged.
Non-U.S. Developed Markets Equity
We are forecasting non-U.S. developed equities to deliver returns similar to U.S. small-caps, but those returns rely more heavily on dividends and less on earnings per share (EPS) growth.
Figure 1 | Components of Real Return Projections in Developed Markets Equities
Data as of 10/31/2025. Source: American Century Investments. Returns are simulated based on capital market assumptions from the Multi-Asset Strategy team’s medium-term forecasts (3-5 Years). Forecasts are not a reliable indicator of future performance. For each asset class, American Century develops a set of assumptions for return, risk, and correlation. Because asset class returns and relationships are ultimately grounded in economic fundamentals, we forecast over the equivalent of a complete economic and market cycle. We arrive at our return forecasts through various modeling techniques, such as a classic valuation approach, a risk-premium approach, and a historical risk and return analysis. In addition to this quantitative process, we employ a qualitative review, recognizing that there are elements that can’t be easily captured by a quantitative process. Further, the quantitative models require forecasting various inputs, which again may contain qualitative elements. Capital market assumptions are not meant to reflect any projection or promise of performance. No guarantee or representation is being made that any account will or is likely to achieve the assumptions shown.
Fixed Income
Our assumptions across most fixed-income categories remain largely unchanged, with moderated expectations for U.S. high yield (as spreads remain tight relative to long-term norms) and convertibles, and a modestly higher cash path.
Our outlook for returns on longer‑dated bonds remains healthy given today’s yields.
Other Asset Classes
Our assumptions for real assets/REITs reflect an uncertain demand environment and a gradual normalization in financing conditions.
Cash returns should remain ahead of inflation, which we expect to average 2.75% in the medium term.
Based on these inputs, we are forecasting a 60/40 global portfolio, with U.S. holdings comprising 60% of each sleeve, to have an annualized return of approximately 6.04% over a five-year period.
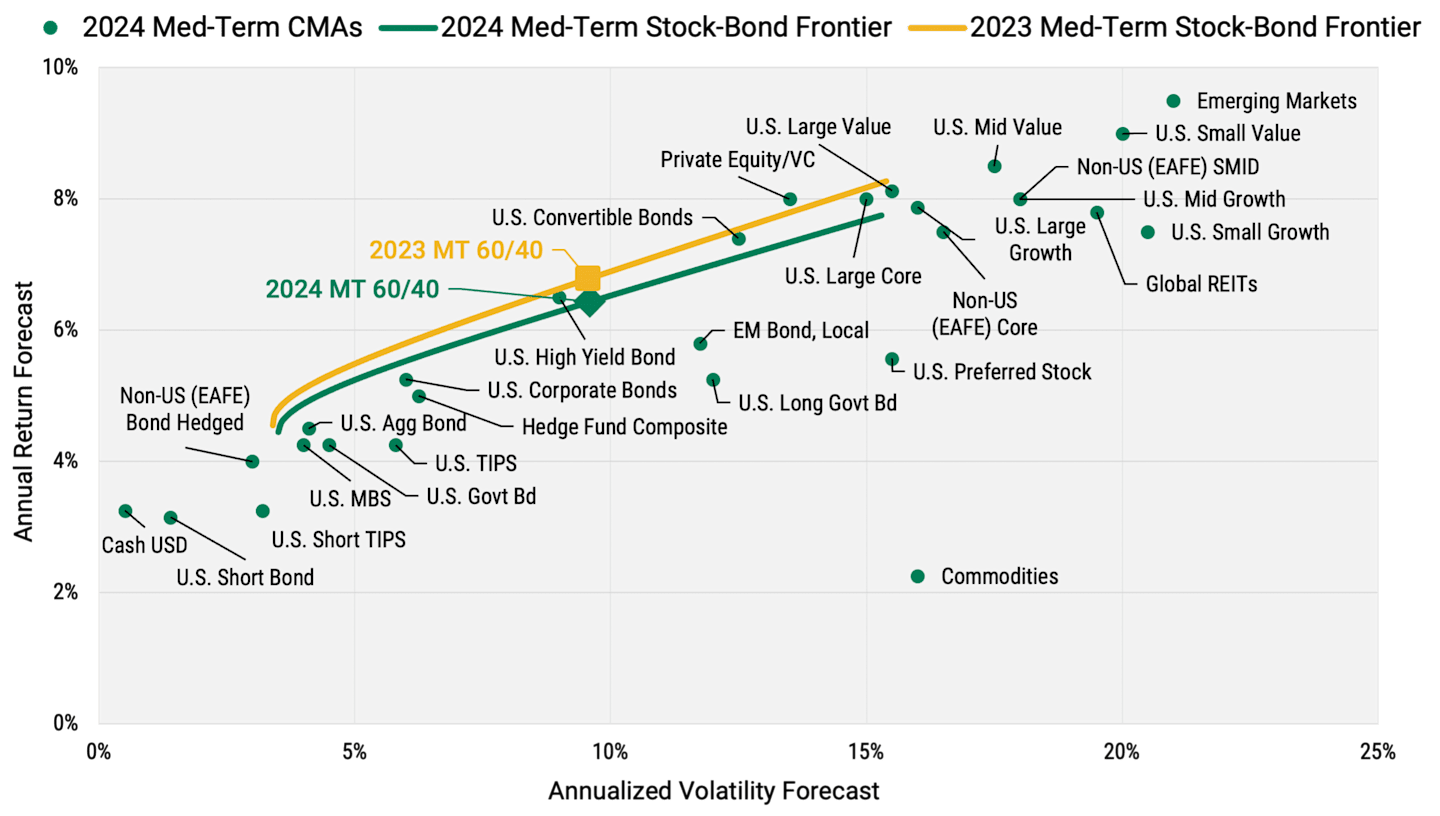
Efficient Frontier Shifts Downward
Annualized return and volatility forecasts continue to drive an efficient frontier that sits modestly below prior years, consistent with valuation normalization and a higher inflation path. See Figure 2.
Figure 2 | Stock-Bond Frontier Shows Slightly Lower Returns
The forecast represents American Century Investments’ view on asset class return and risk over the next three to five years as of October 2025. Opinions and estimates offered constitute our judgment and, along with other data, are subject to change without notice. Risk is represented by annualized standard deviation. Source: American Century Investments.
How We Build Our Capital Markets Assumptions
Our capital markets forecasts are:
Grounded in economic fundamentals.
Transparent about underlying assumptions.
Systematically developed and reviewed to reduce bias.
We use a range of techniques to construct the building blocks of our forecasts across asset classes. These building blocks, which include fundamental inputs such as inflation, cash, real yields, real earnings growth and more, form the basis for an internally consistent set of projections across more than 50 asset classes.
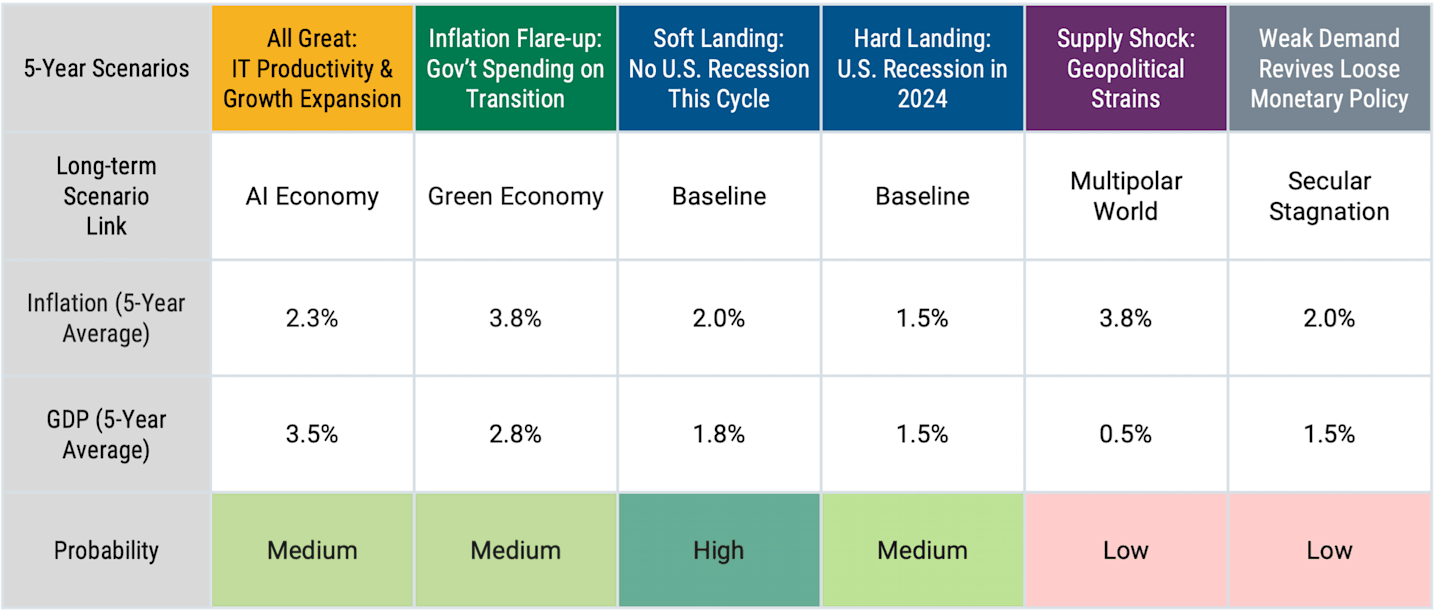
Macro Scenarios and Probability Weighting
Our macro scenario modeling incorporates research on long-term economic drivers. These long-term drivers help us to identify the economic currents that could heavily influence the next five years. We then probability weight each scenario to develop a set of return expectations.
Here, and in Figure 3, we briefly describe our current set of five-year macro scenarios:
Soft Landing: Inflation drifts lower with moderate GDP growth.
Hard Landing: Tighter policy compresses inflation below target at the expense of growth.
Tech Shock: Productivity gains (e.g., AI) lift GDP and earnings and restrain inflation.
Policy Shock: Trade and other policy frictions pressure growth and/or stoke prices.
Climate Change: Physical risks and adaptation costs raise certain price levels and cap growth.
Grey Economy: Aging demographics weaken demand and trend growth.
Figure 3 | A Range of 5-Year Macro Scenarios
The forecast represents American Century Investments’ view on asset class return and risk over the next three to five years as of October 2025. Opinions and estimates offered constitute our judgment and, along with other data, are subject to change without notice.
For an in-depth discussion of our methodology, please see our paper titled “Comprehensive Capital Market Assumptions .” Our long-term (20-year) CMAs are also available on request.
Asset Class Assumptions
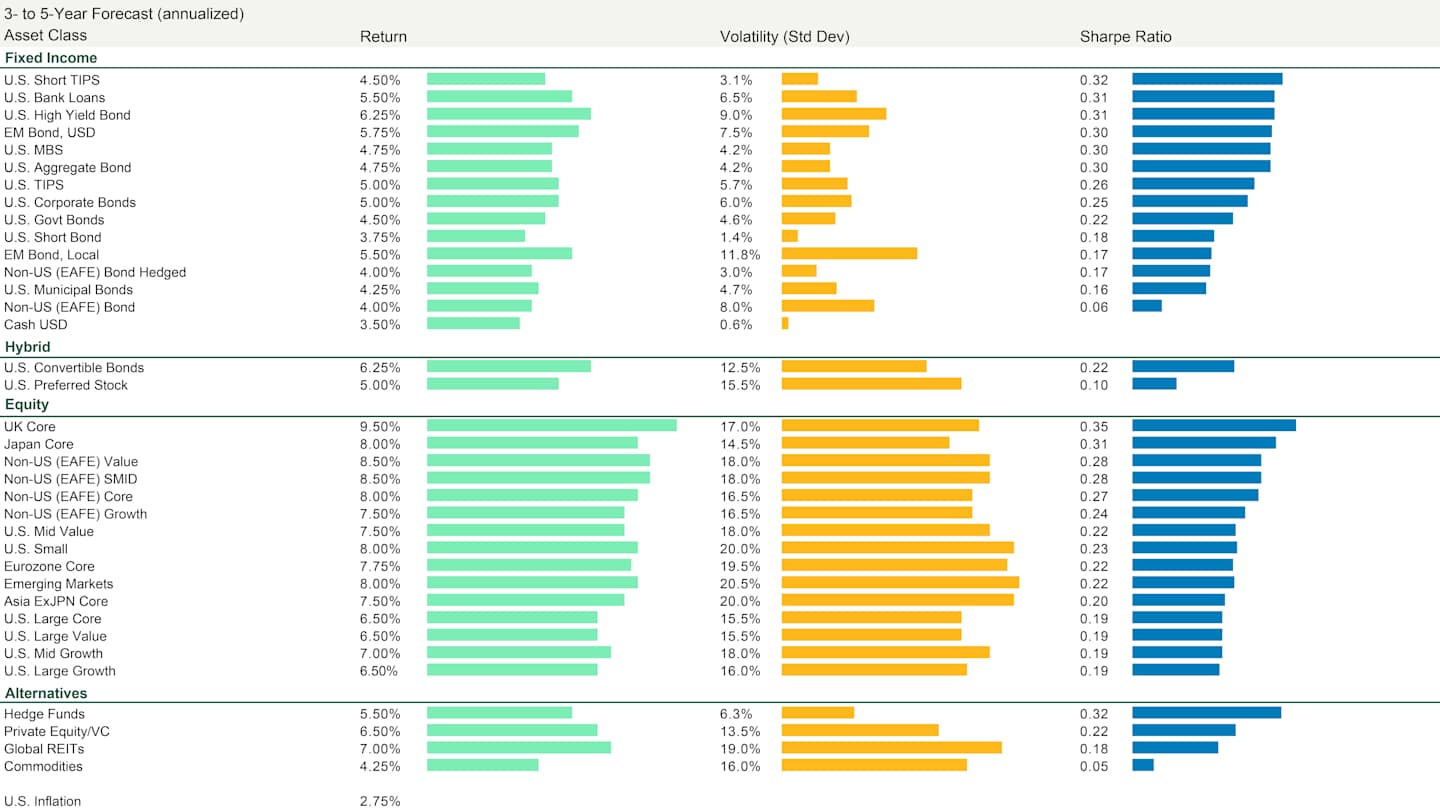
Data as of 10/31/2025. Source: American Century Investments. Returns are simulated based on capital market assumptions from ACI Multi-Asset Strategies’ medium-term forecasts (3-5 Years). Forecasts are not a reliable indicator of future performance. American Century Investments Capital Market Assumptions For each asset class, American Century develops a set of assumptions for return, risk, and correlation. Because asset class returns and relationships are ultimately grounded in economic fundamentals, we forecast over the equivalent of a complete economic and market cycle. We arrive at our return forecasts through various modeling techniques, such as a classic valuation approach, a risk-premium approach, and an historical risk and return analysis. In addition to this quantitative process, we employ a qualitative review, recognizing that there are elements that can’t be easily captured by a quantitative process. Further, the quantitative models require forecasting various inputs, which again may contain qualitative elements. Capital market assumptions are not meant to reflect any projection or promise of performance. No guarantee or representation is being made that any account will or is likely to achieve the assumptions shown.
Authors
Senior Portfolio Manager and Head of Multi-Asset Research
Take a Closer Look at Our Multi-Asset Solutions
The journey matters as much as the outcome.
Related Insights
Multi-Asset Strategies
Fear, FOMO or Fundamentals? A Forward-Looking Framework for Equity Allocations
MAY 04 | 2026
Macro and Market
Fed Leaves Interest Rates Unchanged Amid Ongoing Uncertainties
APR 29 | 2026
Equity
[Software] Apocalypse Now? Separating Existential Risk from Investable Reality
APR 27 | 2026
Forecasts are not a reliable indicator of future performance.
Investment return and principal value of security investments will fluctuate. The value at the time of redemption may be more or less than the original cost. Past performance is no guarantee of future results.
The opinions expressed are those of American Century Investments (or the portfolio manager) and are no guarantee of the future performance of any American Century Investments portfolio. This material has been prepared for educational purposes only. It is not intended to provide, and should not be relied upon for, investment, accounting, legal or tax advice.
The information is not intended as a personalized recommendation or fiduciary advice and should not be relied upon for investment, accounting, legal or tax advice.
No offer of any security is made hereby. This material is provided for informational purposes only and does not constitute a recommendation of any investment strategy or product described herein. This material is directed to professional/institutional clients only and should not be relied upon by retail investors or the public. The content of this document has not been reviewed by any regulatory authority.