What Can Investors Learn From the Yield Curve?
Investing with a crystal ball is wishful thinking, but gazing at the yield curve gives you glimpses into the state of the economy and the markets.

Key Takeaways
The yield curve is a snapshot of yield differences from short- to longer-maturity bonds.
Normal, flat or inverted—the shape of the yield curve can signal where the economy may be headed.
Investors can look at the yield curve for clues on how bonds and even stocks might perform.
The yield curve is a snapshot at a single point in time of the yield differences between bonds of the same credit quality but different maturities.
The most used and referenced yield curve is the U.S. Treasury yield curve. It compares the yields of short-, intermediate- and long-maturity Treasuries and is widely regarded as a bellwether of economic conditions.
Although it plots fixed-income securities, the yield curve is not just for bond investors. Why? Because the yield curve indicates whether investors think the economy is growing, slowing or stalling—and that may affect how stocks and other investments perform.
Bonds are key to balancing risk and reward in a portfolio. But what are they, and how do they work? Get the basics.
What Does the Shape of the Yield Curve Tell Us?
As yields change over time, the shape of the curve changes. For example, the curve could be normal (upward sloping), inverted (downward sloping) or flat depending on prevailing yields.
The shape of the yield curve can tell us about investor demand for bonds and where the economy may be headed.
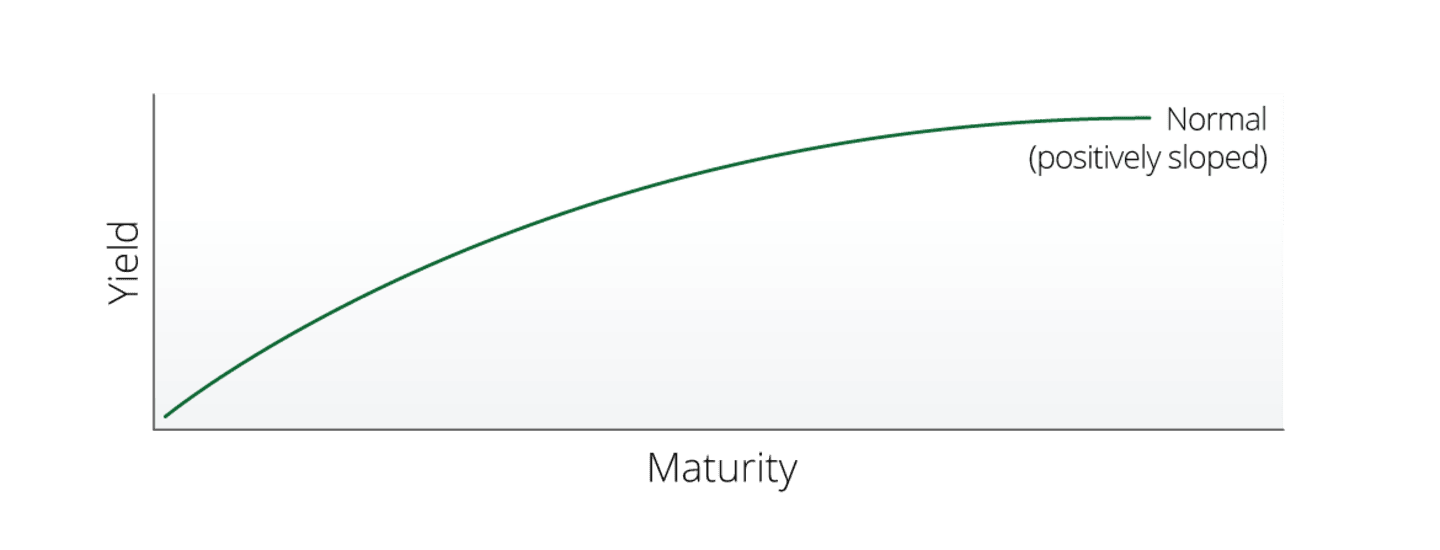
What Is an Upward-Sloping or Normal Yield Curve?
A normal yield curve is an upward-sloping curve that shows yields gradually increasing as bond maturities increase. Under “normal” economic and market conditions, longer-maturity bonds yield more than shorter-maturity ones.
Investors usually demand more compensation for locking up their money for a longer time period and thus taking on greater risk, including inflation and interest rate risk.
Normal or rising yield curves typically are apparent during periods of economic growth.
How Does Inflation Affect the Yield Curve?
A steep curve also may signal higher inflation is on the horizon. That’s because stronger economic growth often leads to price increases on goods and services as demand increases.
Moreover, longer-maturity bond investors seek higher yields to justify keeping their money in the bond market for longer periods.
What Is an Inverted Yield Curve?
An inverted yield curve is a downward-sloping curve that shows shorter-maturity interest rates are higher than longer-maturity rates. Typically, this happens when the Federal Reserve (Fed) is raising interest rates to combat rising inflation rates.
Why would investors accept a lower yield for a longer-term commitment? They may expect the economy to slow or even plunge into a recession and so buy longer-maturity bonds as a defense to help combat a stock market downturn.
Additionally, if the Fed eventually cuts interest rates to restimulate the economy, it would trigger price appreciation on existing bonds (as yields on bonds decline, their prices rise).
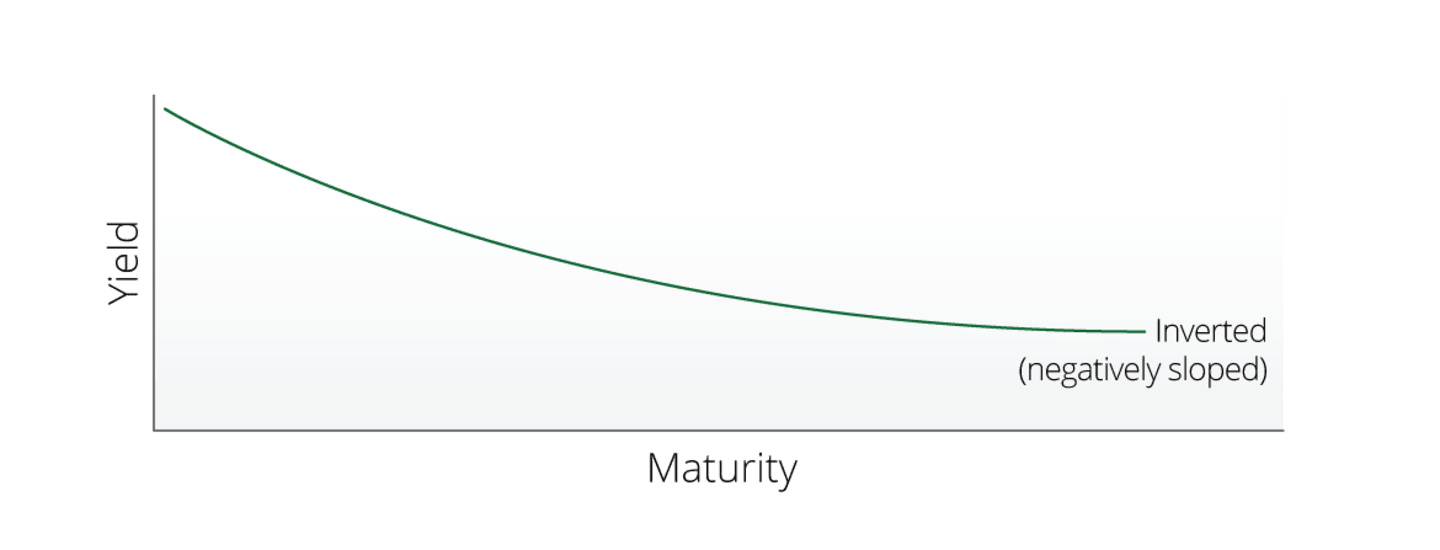
An inverted yield curve has preceded every recession in the last 50 years by about one to two years. With that history, it’s understandable that some people may see a yield curve inversion as an alarm bell—but there are many other moving factors to consider.
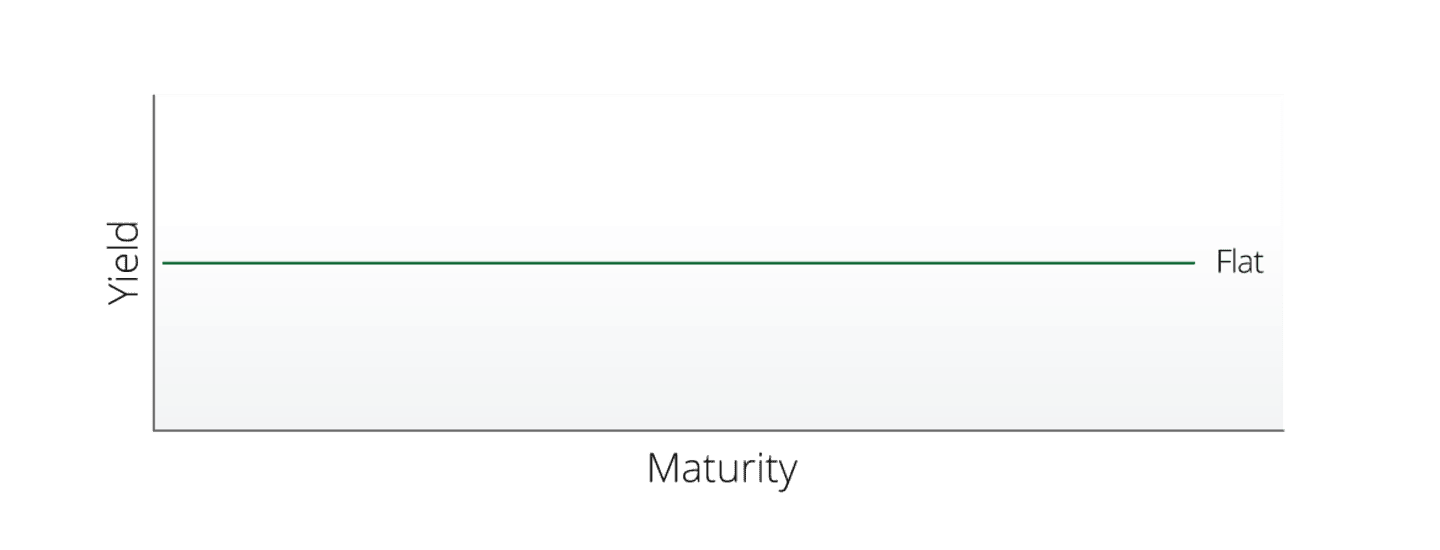
What Is a Flat Yield Curve?
A flat yield curve occurs when shorter- and longer-maturity yields are similar, creating more of a flat line than a curve. This may be because shorter-maturity yields rose or because longer-maturity yields declined, or both.
Investors generally view a flat yield curve as an indicator of uncertainty over future growth.
What Is the ‘Yield Spread’?
When discussing the yield curve, many people also refer to the yield spread. This number is the mathematical difference between the yields of short- and longer-maturity securities, typically the two- and 10-year Treasury notes.
In general, a positive and rising (or widening) yield spread as maturities lengthen indicates the curve is normal or steepening; a declining/narrowing or negative yield spread reflects a flattening or inverting curve.
How the Yield Curve May Be Useful to Investors
Because the yield curve signals what some investors think about the direction and health of the economy, it also sheds light on the performance expectations investors have for stocks and bonds.
When you see a normal or steepening curve.
Some investors may feel like they can take on more aggressive investments that have tended to do well when the economy is growing. And it may be a good time to look at investments that help you stay ahead of inflation.
For instance, some investors might look at stocks with higher growth potential than others, like small-cap growth or even emerging markets stocks.
And high-yield corporate bonds may be appealing. Performance is closely tied with the corporation’s fundamentals and business results. Therefore, high-yield bonds historically have moved in line with the stock market.
But the trade-off for more aggressive investments is more risk. So you want to think about the trade-off between risk and reward and if you have the time to potentially recover from losses if the economy or markets suddenly turn.
When you see an inverting yield curve.
The defensive characteristics of bonds may be more attractive to investors if it appears that the economy is slowing. As the economy slows and appears ready to tip into recession, the Fed likely will cut interest rates. When rates fall, bond prices typically rise.
High-quality bonds tend to be less volatile than stocks, which can enhance diversification and temper overall risk. Additionally, short-maturity bond funds (those with maturities of three years or less) tend to experience lower price volatility than longer-maturity bonds and stocks.
When you see a flattening yield curve.
A focus on quality can be beneficial in a variety of economic environments, but especially when the outlook is uncertain. Higher-quality investment choices, whether in fixed income or equities, may provide a steadier path to growth by better weathering the ups and downs of economic cycles.
Stocks don’t come with ratings like bonds, but investors might look for ones trading at compelling market valuations issued by companies with strong balance sheets and a history of paying dividends.
The Yield Curve Demystified
Yield curves and yield spreads are always changing. These movements are one of many factors experts watch to gauge the health of the economy, the direction of interest rates and even if a bull or bear market may be on the horizon.
No one has a crystal ball to tell the financial future. But paying attention to the yield curve’s movements may help you prepare for the ups and downs—and navigate the world of investments with more confidence.
Seeking to Get Ahead of the Curve?
Take advantage of our complimentary guidance.
Diversification does not assure a profit nor does it protect against loss of principal.
This material has been prepared for educational purposes only. It is not intended to provide, and should not be relied upon for, investment, accounting, legal or tax advice.
Investment return and principal value of security investments will fluctuate. The value at the time of redemption may be more or less than the original cost. Past performance is no guarantee of future results.
Generally, as interest rates rise, the value of the bonds held in the fund will decline. The opposite is true when interest rates decline.