Don't Overlook Mid-Cap Stocks
Mid-cap stocks have a long history of outperforming their larger and smaller peers with less volatility than small-caps.

Key Takeaways
Investors tend to have limited exposure to mid-cap stocks, even though this investment category offers an attractive balance of risk and reward.
Many mid-sized companies have proven business models, capable management teams and well-established customer bases and brands.
Mid-cap stocks have outperformed large-cap and small-cap stocks for over 40 years.
Imagine creating an investment strategy that enhances performance potential without increasing your exposure to smaller, riskier companies. Many of us would likely find this appealing. However, it seems that many investors don’t take this approach when it comes to mid-capitalization (mid-cap) stocks.
Even though mid-caps have a history of outperforming their large- and small-cap peers, most investors are underexposed to this category.1 In this article, we discuss why we think mid-cap stocks represent the stock market's sweet spot and how allocating to this space has the potential to improve stock portfolio returns without taking on the risk of increasing small-cap exposure.
Why Mid-Cap Stocks Are Worth Your Attention
In some ways, mid-caps are like the unappreciated middle child. Large companies are often high-profile names that everyone recognizes. Meanwhile, smaller companies may benefit from industry buzz and offer the alluring potential of getting in on the ground floor.
Mid-cap companies, on the other hand, are sometimes overlooked. With market capitalizations between roughly $11 billion and $65 billion, many successful mid-cap companies have proven business models, capable management teams and established customer bases and brands. While they have evolved from small-cap stocks, many still possess significant growth potential.
In our view, it’s a mistake to overlook mid-caps in favor of the stock market’s largest and smallest companies. Figure 1 shows the growth of hypothetical investments in large-, mid- and small-cap stocks since the 1978 inception of the Russell Midcap® Index.
Mid-cap stocks would have generated more than twice the wealth of small-caps and approximately 40% more than large-caps. During that time, a $10,000 investment in mid-sized companies would have grown to nearly $2.6 million compared to $1.8 million for large-cap stocks and $1.2 million for small-cap stocks.2
When reviewing investment performance, it's important to remember that investing involves risk, and the period studied includes stretches of negative performance.
Figure 1 | Mid-Cap Stocks Have Historically Outperformed Large- and Small-Caps
Hypothetical Growth of $10,000 (in Millions)
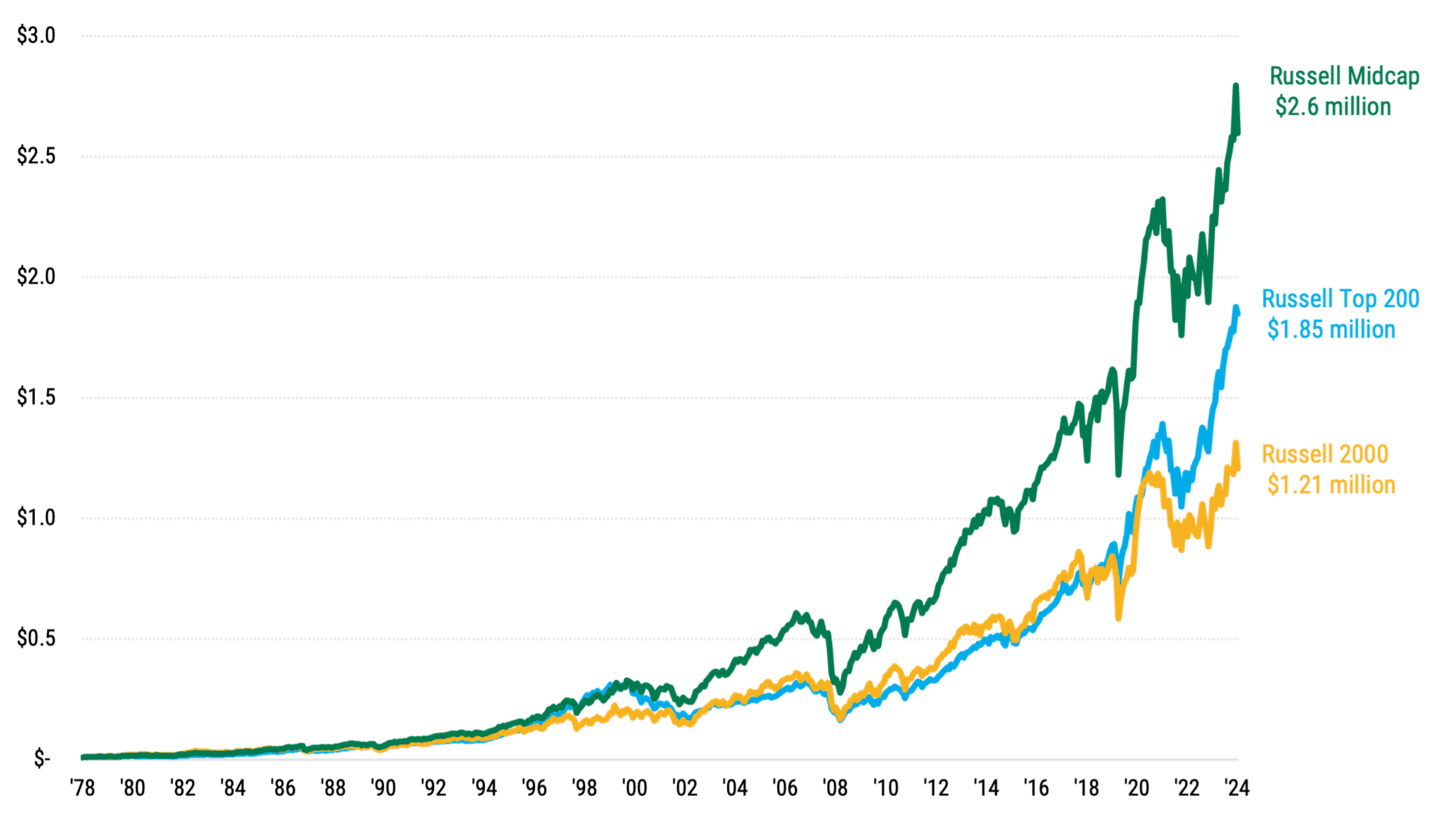
Data from 12/31/1978 - 12/31/2024. Source: FactSet. The Russell Midcap® Index represents mid-cap stock performance. The Russell Top 200® Index represents large caps, and the Russell 2000® Index represents small caps. The indices are not investment products available for purchase. Past performance is no guarantee of future results. This hypothetical situation contains assumptions that are intended for illustrative purposes only and are not representative of the performance of any security. There is no assurance similar results can be achieved, and this information should not be relied upon as a specific recommendation to buy or sell securities.
The Historical Success of Mid-Cap Stocks
Mid-cap stocks have a historical pattern of outperformance compared to large- and small-cap stocks. It becomes clear when we analyze rolling five-year performance snapshots, which typically capture rising and falling stock market environments.
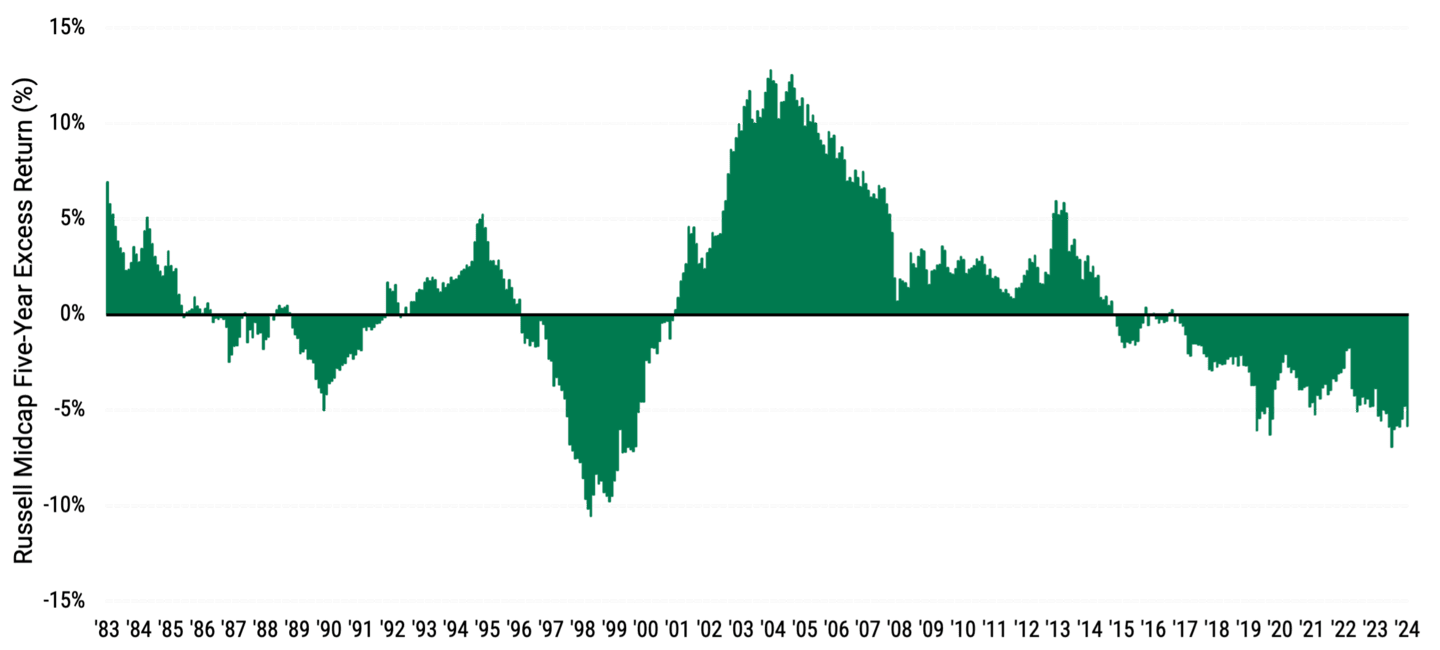
As shown in Figure 2 Panel A, mid-cap stocks have outperformed large-caps in 54% of rolling five-year periods since 1983. Mid-caps also outperformed small-caps 89% of the time during the same period, as Panel B illustrates. These rolling observations include periods of negative investment returns.
A closer look at the data reveals that mid-caps historically outperformed large-caps when the market favored smaller stocks. Similarly, they outperformed smaller stocks when investors preferred the stocks of larger companies.3
Figure 2 | Rolling Returns Demonstrate a History of Mid-Cap Outperformance
Panel A | Mid-Caps vs. Large-Caps
Panel B | Mid-Caps vs. Small-Caps
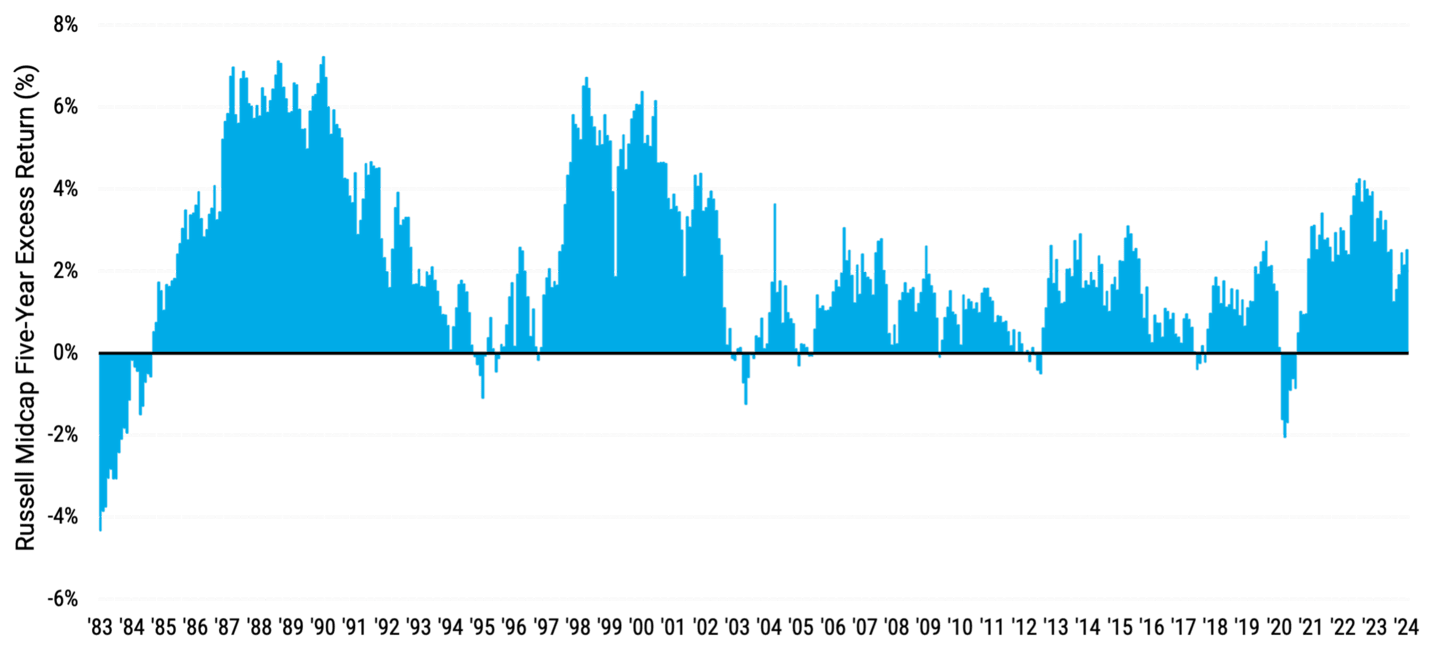
Data for both charts from 12/31/1978 - 12/31/2024. Source: FactSet. The charts depict rolling monthly observations of trailing five-year returns. Excess return refers to the difference in performance of the indexes we are comparing and can be expressed as a positive or negative number. Bars above the 0% line indicate the amount of mid-cap outperformance. Bars below the line indicate the amount of mid-cap underperformance. The performance period began on 12/31/1978, with the first five-year return observation on 12/31/1983. The Russell Midcap® Index represents mid-cap stock performance. The Russell Top 200® Index represents large caps, and the Russell 2000® Index represents small caps. The indices are not investment products available for purchase. Past performance is no guarantee of future results.
Investors May Be Underexposed to Mid-Cap Stocks
Despite mid-cap stocks' track record, investors may have inadequate exposure to this portion of the equity market. Mid-caps account for 23% of the domestic equity universe, yet, according to Morningstar, as of March 31, 2024, the asset class represents only 10% of investors' domestic equity mutual fund assets.
Some of the underexposure may be due to a misperception of the Russell 1000® Index's composition. Because the index includes large-cap stocks (the 200 largest publicly traded U.S. companies, based on total market capitalization) and mid-cap stocks (the remaining 800), investors may believe their index fund or exchange-traded fund provides adequate mid-cap exposure.
In reality, larger companies have an oversized impact on the index's results. At the end of 2024, the 200 largest companies comprised about 90% of the Russell 1000's weight, dwarfing the effect of the index's 800 mid-cap companies.
Faulty diversification strategies may be another reason for underexposure to mid-caps. When building their stock portfolios, investors may overweight the market's largest companies due to their defensive characteristics.
At the same time, they may seek to increase their portfolio's return potential by investing in the market's smallest and one of the riskiest stocks. Such an approach bypasses the attractive risk and return potential of mid-caps.
Mid-Cap Stocks: A Key Component of Diversification
We think mid-caps represent a time-tested market sweet spot with a history of outperforming large- and small-cap stocks. Their performance and risk characteristics offer the potential to improve stock portfolio returns while reducing risk compared to small-caps.
Authors
Portfolio Manager
Senior Client Portfolio Manager
Ready to Invest in Mid-Caps?
We believe a combination of actively managed growth and value portfolios may be advantageous in the mid-cap space.
Morningstar, as of 12/31/2022.
FactSet, as of 12/31/2024.
FactSet, as of 12/31/2024.
Investment return and principal value of security investments will fluctuate. The value at the time of redemption may be more or less than the original cost. Past performance is no guarantee of future results.
Historically, small- and/or mid-cap stocks have been more volatile than the stock of larger, more-established companies. Smaller companies may have limited resources, product lines and markets, and their securities may trade less frequently and in more limited volumes than the securities of larger companies.
Diversification does not assure a profit nor does it protect against loss of principal.
The opinions expressed are those of American Century Investments (or the portfolio manager) and are no guarantee of the future performance of any American Century Investments portfolio. This material has been prepared for educational purposes only. It is not intended to provide, and should not be relied upon for, investment, accounting, legal or tax advice.
©2026 Morningstar, Inc. All Rights Reserved. Certain information contained herein: (1) is proprietary to Morningstar and/or its content providers; (2) may not be copied or distributed; and (3) is not warranted to be accurate, complete or timely. Neither Morningstar nor its content providers are responsible for any damages or losses arising from any use of this information.
Mutual Funds: American Century Investment Services, Inc., Distributor.
Exchange Traded Funds (ETFs): Foreside Fund Services, LLC – Distributor, not affiliated with American Century Investment Services, Inc.