Investing During a Presidential Election Year
What should investors do as the race for the White House heats up? History suggests that staying the course is the most prudent answer.

Key Takeaways
U.S. presidential election years have historically produced positive returns for stock and bond investors.
Variables in play for this year’s election have correlated with positive portfolio returns in the past.
We believe long-term investors should maintain their usual investment approach, regardless of polls and politics.
Americans evaluate candidates for U.S. president, Congress and other public offices every four years. And given the rhetoric of today’s polarized political environment, you might worry about your portfolio or be reluctant to stick to your long-term investment strategy.
Are you considering cashing in to avoid potential market volatility during this presidential election year?
Historical stock and bond market data indicates giving in to this temptation wouldn't be wise. It’s important to remember that the long-term trend in stock and bond prices is positive. And, as we’ll point out in this article, this trend generally holds during presidential election years.
As shown in Panel A of Figure 1, U.S. stocks have historically surged as election-year campaigns reached their crescendos. Indeed, stocks have gained an average of 10% in presidential election years since 1976. On the downside, this stretch includes one of the worst years in U.S. stock history, a 37% drop amid the global financial crisis in 2008. The only other negative presidential election year result since 1976 was a 9% decline when the dot-com bubble burst in 2000.
On the other hand, the U.S. bond market (as measured by the Bloomberg U.S. Aggregate Bond Index) has never failed to deliver a positive presidential election year result over the last 50 years. See Panel B of Figure 1. On average, bonds have gained more than 7% when voters chose the commander in chief.
Figure 1 | U.S. Stock and Bond Performance in Presidential Election Years
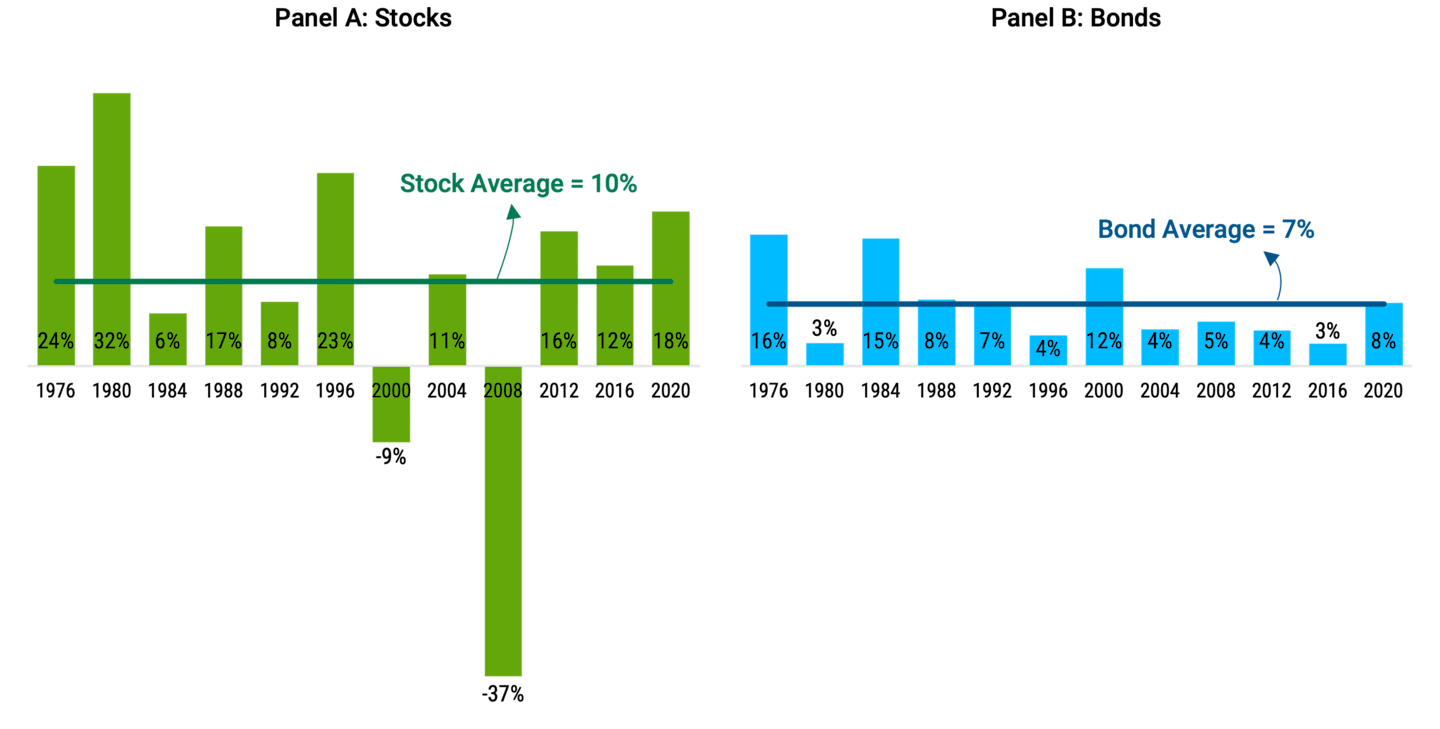
Data from 1976 – 2023. U.S. stocks and bonds are represented by the S&P 500 Index and Bloomberg U.S. Aggregate Bond Index, respectively. Source: Morningstar. Past performance is no guarantee of future results.
Pondering 2024 Stock Market Possibilities
Certain factors in the 2024 election may bode well for U.S. markets this year if history provides any guide.
President Joe Biden seeks reelection, and the S&P 500® Index hasn’t declined during any election year that an incumbent sought another term since Dwight Eisenhower did so in 1956. In the 10 reelection campaigns since then, the index has risen an average of more than 18%.1
Moreover, the 2024 presidential race follows the 2022 mid-term election year when U.S. stocks declined. Since World War II, U.S. stocks have advanced during every year that a presidential election followed a stock market slide two years earlier. See Figure 2. The average gain is 13.4%.
Figure 2 | Historically, Presidential Elections Have Revived U.S. Stocks
Data from 1/1/1946 – 12/31/2022. U.S. stocks are represented by the S&P 500 Index. Source: Slickcharts. Past performance is no guarantee of future results.
Navigating Stock Market Volatility in U.S. Presidential Election Years
Regardless of their importance, presidential elections still take a back seat to economic conditions and national or global disasters. U.S. stocks have fallen in presidential election years only four times over the last 100 years. In these instances, historic events overshadowed each election’s impact:
1932, the stock market crash in 1929 and resulting Great Depression.
1940, the waning of the Great Depression and first full year of World War II.
2000, the dot-com bubble crash.
2008, the global financial crisis.
Investors head into this presidential election year coming off a 2023 in which a much-anticipated recession didn’t materialize. Recession concerns haven’t dissipated completely, but economic consensus suggests the Federal Reserve (Fed) will successfully negotiate a soft landing for the U.S. economy in 2024.2
Recession or not, investor uncertainty tends to heighten stock market volatility during the run-up to Election Day and then decreases afterward.3 We don’t think the possibility of higher volatility should cause investors to avoid the market. On the contrary, we believe investors should stick with their diversified investment strategy instead of trying to time the election by toggling between stocks and cash.
Stocks and Bonds Have Tended to Rise Regardless of the Election Cycle
Historical election-year market trends don’t affect how American Century’s portfolio managers select securities or make asset allocation decisions.
Moreover, it’s essential to recognize the limitations of the historical trends we’ve discussed. From a statistical standpoint, you shouldn’t rely too heavily on any trends or correlations the data may show.
However, the long-term performance of stocks and bonds remains impressive. The long-term stock market gains have historically overshadowed the short-term fluctuations influenced by external events like presidential elections.
Our analysis confirms that stocks and bonds have usually moved higher during presidential election years. And that’s primarily because they have tended to move higher in any given year — election or not. That’s why we think sticking to your diversified investment approach may be your most prudent vote.
Authors
Explore More Insights
Read our latest articles and market perspectives.
Strategas Policy Outlook, “Policy Uncertainty Highest in Presidential Election Years,” November 15, 2023; Slickcharts, ”S&P 500 Total Returns.”
Gabriel T. Rubin, “Nation’s Top Economists Are Short-Term Happy, Long-Term Glum,” Wall Street Journal, January 7, 2024.
American Century, FactSet.
Past performance is no guarantee of future results. Investment returns will fluctuate and it is possible to lose money.
Diversification does not assure a profit nor does it protect against loss of principal.
The opinions expressed are those of American Century Investments (or the portfolio manager) and are no guarantee of the future performance of any American Century Investments portfolio. This material has been prepared for educational purposes only. It is not intended to provide, and should not be relied upon for, investment, accounting, legal or tax advice.