Yield Curve Dynamics Highlight Value for Municipal Bond Investors
Market Minute | Today’s yield backdrop suggests intermediate- and longer-duration municipal bonds (munis) may offer attractive value versus U.S. Treasuries.

Key Takeaways
We believe muni/Treasury ratios are more attractive among longer-maturity securities.
The municipal bond yield curve is steep, meaning that longer-maturity munis have historically offered potential yield advantages and favorable roll-down effects.
Meanwhile, recent dynamics suggest short-maturity ratios favor Treasuries.
Download Market Minute: Yield Curve Dynamics Highlight Value for Municipal Bond Investors.
Muni/Treasury Ratios Pinpoint Opportunities
The muni/treasury ratio compares the yield of a municipal bond to Treasury yields. It’s calculated by dividing the yield on a municipal bond by the yield on a Treasury bond.
How Do You Use the Muni/Treasury Ratio?
The ratio helps investors understand whether municipal bonds represent good value versus Treasuries.
As the ratio moves higher, municipal bonds become more attractive.
When the ratio is moving lower, Treasuries may be more appealing.
Figure 1 shows the three-year trend of muni/Treasury ratios for two-, 10- and 30-year securities. The ratio has historically been higher for longer-maturity securities.
Figure 1 | Higher Ratios Signal Municipal Bond Value

Data from 9/2/2022 – 8/31/2025. Source: FactSet, Bloomberg. Past performance is no guarantee of future results.
Bloomberg AAA Municipal Bond Index: This index tracks the performance of AAA-rated municipal bonds issued by U.S. state and local governments. It is a subset of the broader Bloomberg Municipal Bond Index, a market value-weighted index designed for the long-term tax-exempt bond market.
Longer-Maturity Munis May Offer Value
Along with ratios, the muni and Treasury yield curves can help investors uncover value. Figure 2 highlights the longer portions of the yield curves.
The chart shows yields on 10- and 30-year munis at 2.9% and 4.3%, respectively. It also shows the yields on 10- and 30-year Treasuries at 4.1% and 4.7%, respectively.
A 3% tax-free yield corresponds to a 5.1% taxable yield for an investor paying the highest tax rate. (See Figure 4.) This suggests the 10-year muni yielding 2.9% was actually a better value than the 10-year Treasury yielding 4.1%.
Similarly, the 30-year muni represented a better value than the 30-year Treasury. The taxable-equivalent yield1 of a muni with a 4% yield is nearly 6.8%. (See Figure 4.) The 30-year Treasury yield was considerably less, at 4.7%.
Figure 2 | Opportunities Emerge Further Out On the Curve
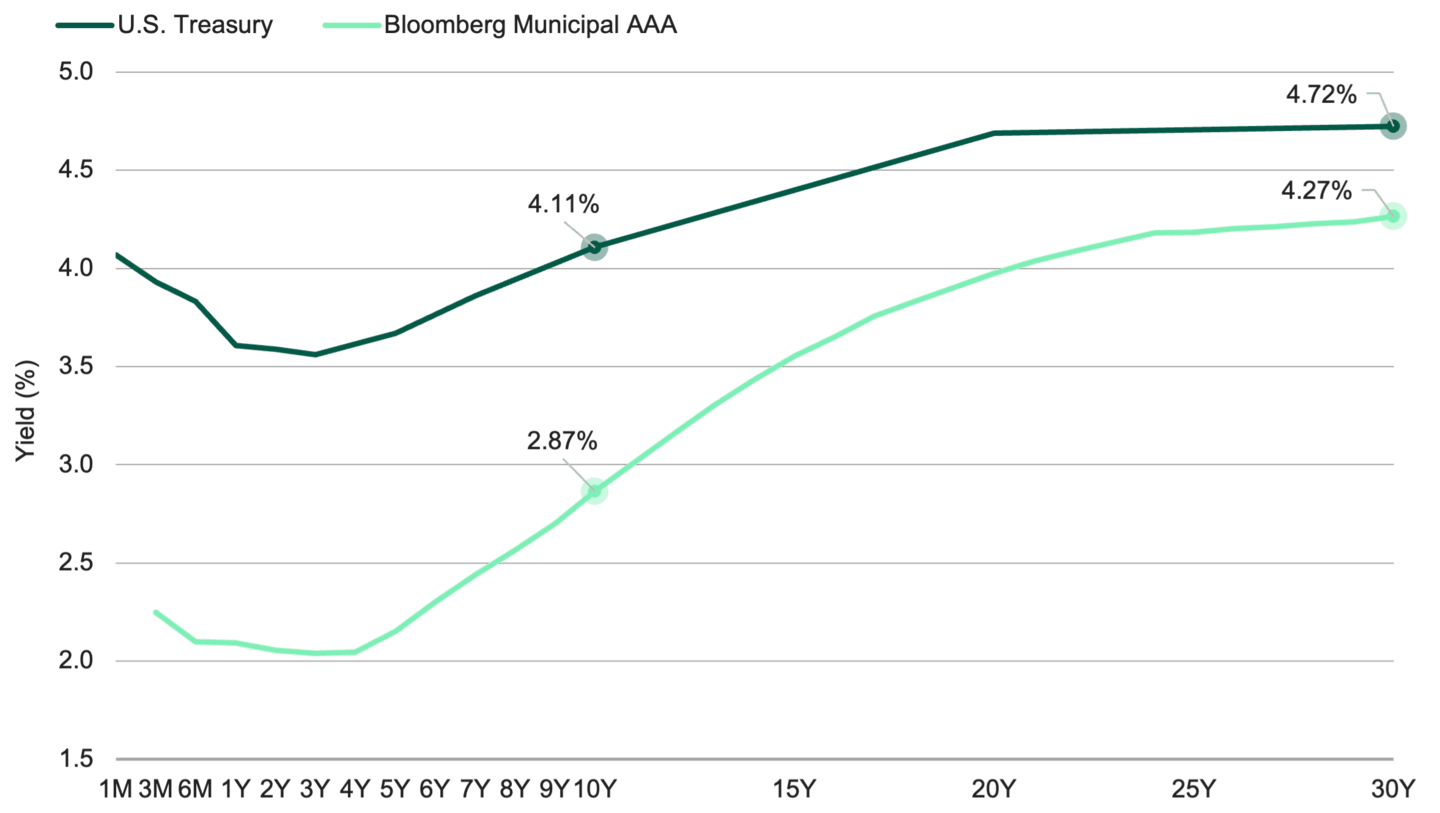
Data as of 9/23/2025. Source: FactSet, Bloomberg.
Dynamics Differ Among Shorter Securities
Meanwhile, among short-maturity securities, the muni/Treasury ratio recently favored Treasuries:
Figure 3 puts the yield on two-year high-quality munis at 2.1% and the two-year Treasury yield at 3.6%.
A 2% tax-free yield has a taxable-equivalent yield of 3.4% for investors paying the highest federal tax rate. (See Figure 4.)
As Figure 2 illustrates, the two-year Treasury offered a yield of 3.6%. Because its yield is higher than the taxable-equivalent yield, the Treasury is a better value for investors paying the highest tax rate.
Figure 3 | Assessing Short-Maturity Dynamics

Data as of 9/23/2025. Source: FactSet, Bloomberg.
Bottom Line: Extending Duration May Offer Opportunities
On a relative value basis, we believe high-quality intermediate- to longer-duration securities may offer compelling opportunities for municipal bond investors:
We believe muni/Treasury ratios are more attractive among longer-maturity securities.
The municipal bond yield curve is steep, which means longer-maturity munis have tended to offer potential yield advantages and favorable roll-down effects2 historically.
Meanwhile, recent dynamics suggest short-maturity ratios favor Treasuries.
What’s more, even on an absolute basis, we believe today’s municipal bond market may offer potentially attractive yields for fixed-income investors seeking opportunity and diversification.
Taxable-Equivalent Yields
A municipal bond’s taxable-equivalent yield tells investors if munis make sense from a tax perspective. It puts munis and taxable bonds on an even playing field.
Figure 4 shows several tax-free yields and their taxable equivalents for each federal income tax rate. The highlighted row represents yields for the highest tax rate, which we used in the examples above.
Figure 4 | Taxable-Equivalent Yields
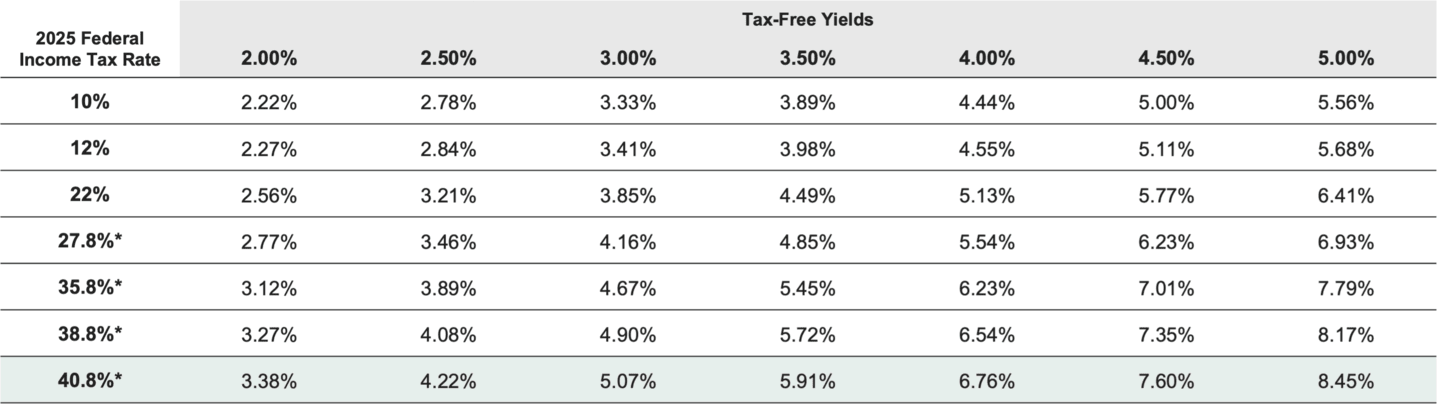
*Includes a 3.8% Net Investment Income Tax. Data as of 12/31/2024. Source: American Century Investments.
Authors
Senior Director, Product Management
Check Out More of Our Market Minute Articles
Investment insights for savvy investors.
Taxable-equivalent yield: The return a taxable investment would need to earn to equal the after-tax return of a tax-free investment. Investors use this calculation to make a fair comparison between taxable bonds and tax-free municipal bonds.
Roll-down effect: As a bond ages and its time to maturity shortens, it “rolls down” the yield curve. When the yield curve is steep, a longer-maturity bond typically has a higher yield than shorter-maturity bonds. As it rolls down the curve and moves closer to maturity, its yield decreases and its price increases.
IRS Circular 230 Disclosure: American Century Companies, Inc. and its affiliates do not provide tax advice. Accordingly, any discussion of U.S. tax matters contained herein (including any attachments) is not intended or written to be used, and cannot be used, in connection with the promotion, marketing or recommendation by anyone unaffiliated with American Century Companies, Inc. of any of the matters addressed herein or for the purpose of avoiding U.S. tax-related penalties.
This information is for educational purposes only and is not intended as tax advice. Please consult your tax advisor for more detailed information or for advice regarding your individual situation.
This information is for educational purposes only and is not intended as investment or tax advice.
Credit quality ratings on underlying securities of a fund are obtained from three Nationally Recognized Statistical Rating Organizations ("NRSROs"), Standard & Poor's, Moody's and Fitch. Ratings are converted to the equivalent Standard & Poor's rating category for purposes of presentation. For municipal funds, each security is assigned the highest rating provided by the NRSROs. A "non-rated" designation is assigned when a public rating is not available for a security. This designation does not necessarily indicate low credit quality. The letter ratings are provided to indicate the credit worthiness of the underlying bonds in the portfolio. Long-term ratings generally range from AAA (highest) to D (lowest). Includes payable amounts related to securities purchased but not settled at period end. Due to rounding, these values may exceed 100%.
Even though a tax-free bond fund is designed to purchase assets exempt from federal taxes, there is no guarantee that all of the fund’s income will be exempt from federal income tax or the federal alternative minimum tax (AMT). Fund managers may invest assets in debt securities with interest payments that are subject to federal income tax and/or federal AMT. State and local taxes may also apply.
Diversification does not assure a profit nor does it protect against loss of principal.
Investment return and principal value of security investments will fluctuate. The value at the time of redemption may be more or less than the original cost. Past performance is no guarantee of future results.
Generally, as interest rates rise, the value of the bonds held in the fund will decline. The opposite is true when interest rates decline.
The opinions expressed are those of American Century Investments (or the portfolio manager) and are no guarantee of the future performance of any American Century Investments portfolio. This material has been prepared for educational purposes only. It is not intended to provide, and should not be relied upon for, investment, accounting, legal or tax advice.