Active Investing: What 2026 May Hold for U.S. Corporate Bonds
Interpreting today’s tight spreads and elevated yields with context on events and fundamentals.

Key Takeaways
Corporate bond spreads remain historically tight, but attractive yields continue to support attractive performance potential.
Unlike passive strategies tied to an index, our active approach targets overlooked opportunities from specific themes and events.
Corporate balance sheets seem solid, which we believe offers extra support for the performance potential of corporate bonds in 2026.
While today’s corporate bond market offers compelling yields, it also appears overvalued, as historically tight credit spreads suggest. This backdrop has prompted some investors to stay on the sidelines, waiting for a sell-off to re-enter the market.
As active investors, we reject this short-sighted strategy. We believe rigorous research provides a better alternative by helping to uncover market dislocations and event-driven opportunities. Our goal is to find bonds we believe are attractive in all market climates, delivering investment opportunities that are out of reach for passively managed strategies.
This approach drives our optimism regarding corporate bonds. These key market characteristics also strengthen this sentiment:
Current yields and the yield outlook remain appealing.
Event-driven opportunities are abundant.
Corporate fundamentals appear solid.
We believe the supply outlook favors active managers.
All-In Yields Help Ease Valuation Concerns
Valuations in the corporate bond market remain rich compared to historical averages. Over the 20 years ending December 31, 2025, the average investment-grade corporate bond spread (Bloomberg U.S. Corporate Bond Index) was 148 basis points (bps). However, on December 31, the spread was only 78 bps.
Despite these valuations, overall corporate bond yields have been attractive. As Figure 1 illustrates, all-in yields, as defined by credit spreads plus U.S. Treasury yields, have hovered near their highest levels since 2009.
Figure 1 | All-In Yields Have Been Attractive
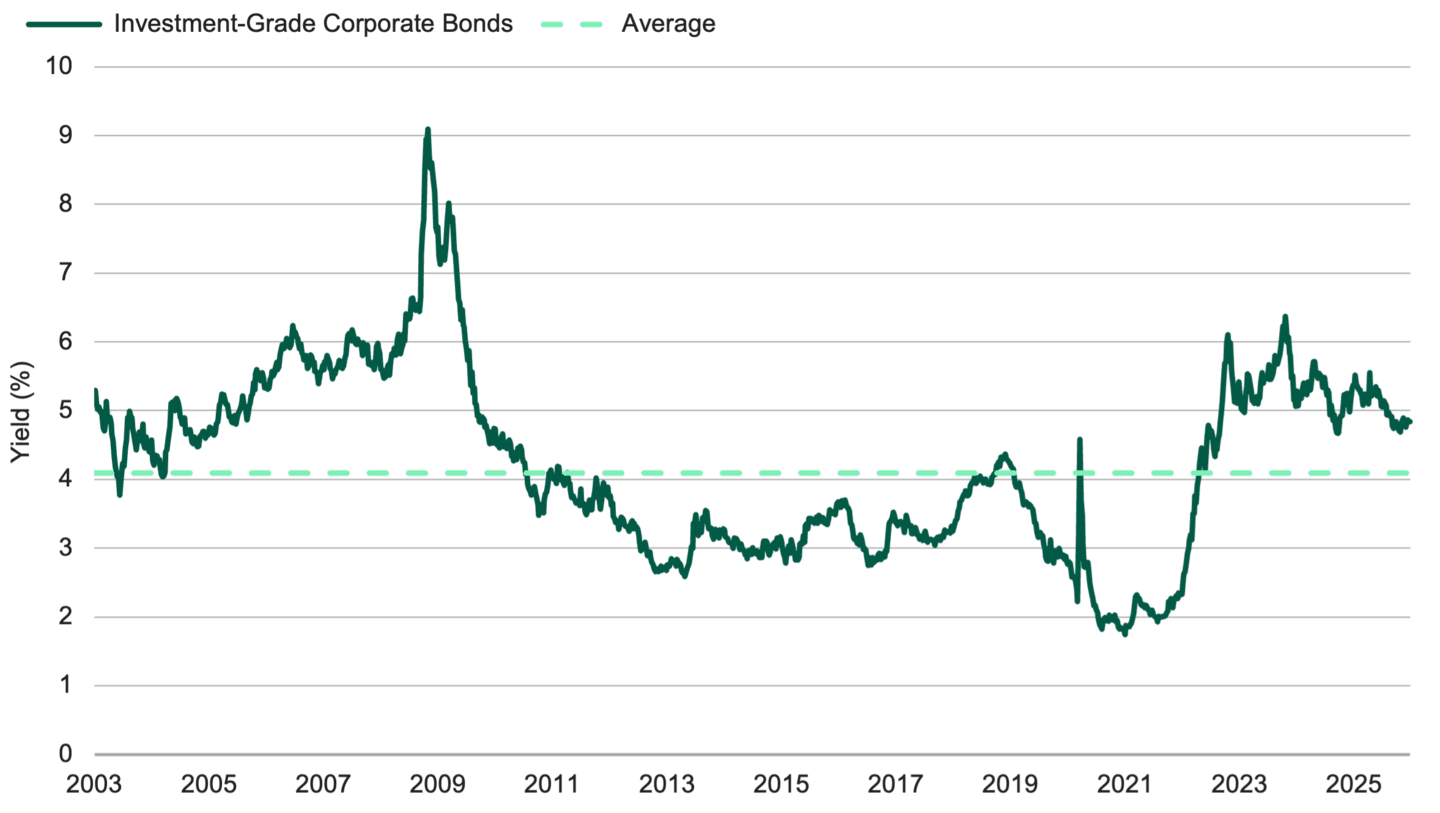
Data from 1/1/2003 – 12/31/2025. Source: Bloomberg. IG Corporate Bonds represented by the Bloomberg U.S. Corporate Bond Index. Past performance is no guarantee of future results.
Sherman Ratio: How Much Room Before Returns Erode?
Some may argue that today’s historically tight spread levels make corporate bonds susceptible to losses. The Sherman Ratio helps evaluate this risk. This metric measures how many basis points credit spreads or yields can rise before investors experience a loss over a 12-month period.
As shown in Figure 2, the Sherman Ratio was 70 bps at year-end 2025. This indicates that credit spreads or yields would have to increase 70 bps before 12-month returns decline — a scenario our research currently suggests is unlikely.
Figure 2 | Sherman Ratio Shows Strength
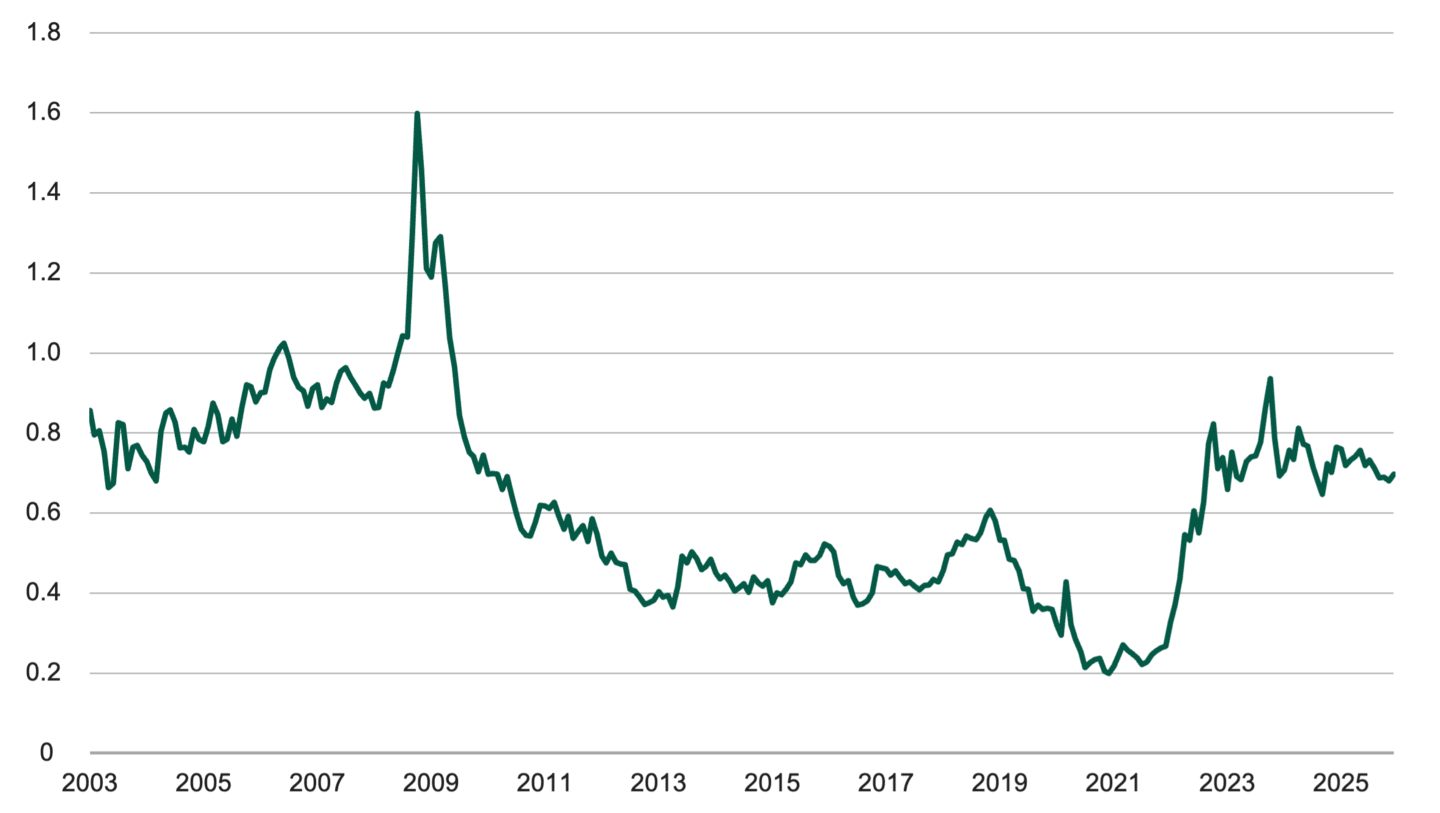
Data from 1/1/2003 – 12/31/2025. Source: Bloomberg. *Yield-to-worst is a worst-case scenario metric that refers to the lowest possible return an investor can receive when holding a callable bond to maturity.
Today’s elevated yields provide a significantly larger break-even cushion for investment-grade corporate bonds compared with the past several years. In our view, this reduces downside risk, even if Treasury yields or credit spreads rise.
2026 Outlook Favors Barbell Yield Curve Positioning
Given our outlook for Federal Reserve (Fed) policy, we expect the overall yield backdrop to remain attractive in 2026. In addition to shaping the curve’s shorter end, Fed policy sets the path for funding costs and the broad yield backdrop. We think the Fed may cut rates only once this year, which should help maintain a compelling yield environment overall.
Meanwhile, we also believe the economy will likely grow at an above-trend pace in 2026. We can’t rule out an overheating economy, which could support a “bear-steepening” bias among bond investors. This occurs when the economy overheats and inflation risk rises, driving longer-maturity yields higher and the yield curve steeper.
Against this potential backdrop, we favor a short- to intermediate-duration stance and believe a barbell yield curve strategy makes sense. This approach combines high‑quality, short‑duration positions for liquidity and intermediate-maturity positions for yield. It’s a strategy that helps preserve flexibility as policy and inflation data evolve.
Events Are Driving Investment Decisions
In a market where valuations aren’t readily apparent, we look for event-driven opportunities offering a balance of yield and total return potential. Our strategy has five components:
Thematic trades: Market, economic and industry trends often highlight value among select styles, sectors and securities. Recent themes have included short-duration high-yield securities, select European financial sector bonds and rising stars.1
Catalysts: Events such as bond tenders (when an issuer invites existing bondholders to sell back their bonds) and mergers and acquisitions (M&A) may create compelling opportunities for active investors.
Unrecognized value: Our research efforts often identify relative value among underfollowed securities.
New issues: Bond issuers sometimes offer extra yield to attract investors to new bonds.
Reverse inquiries: Allows investors to customize bonds with tailored terms.
Corporate Fundamentals: Revenue and EBITDA Trends
Several measures of corporate balance sheet health suggest that corporate fundamentals remain on solid ground, as Figure 3 illustrates. Specifically, revenue and EBITDA (earnings before interest, taxes, depreciation and amortization) growth have been robust, supporting strong credit metrics. Momentum has accelerated despite headwinds from commodity prices.
Technology and health care companies have led this trend, with margins near peak levels and modest debt growth. These metrics underscore disciplined balance sheet management.
A surge in capital expenditures, primarily from highly rated technology and media companies to fund artificial intelligence (AI) initiatives, remains a potential headwind. While this dynamic is unlikely to impair near-term credit quality, it may lead to greater market scrutiny over time.
Figure 3 | A Positive Backdrop for Corporate Fundamentals
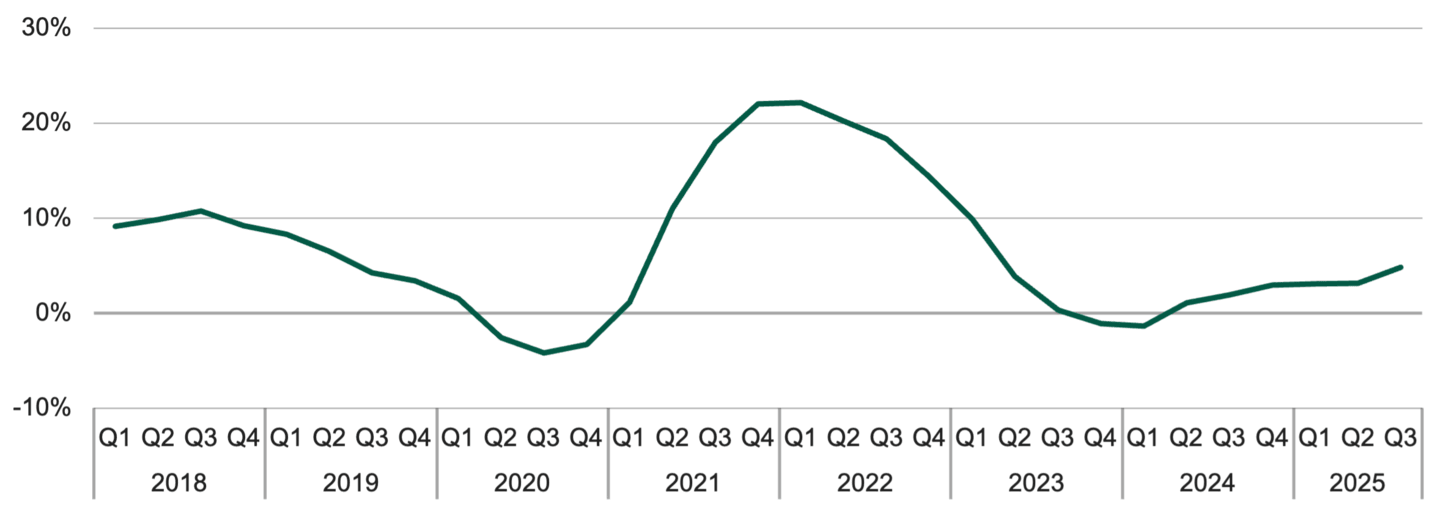
Data from 1/1/2018 – 9/30/2025. Source: JP Morgan, FactSet.
Interpreting Low Default Rates
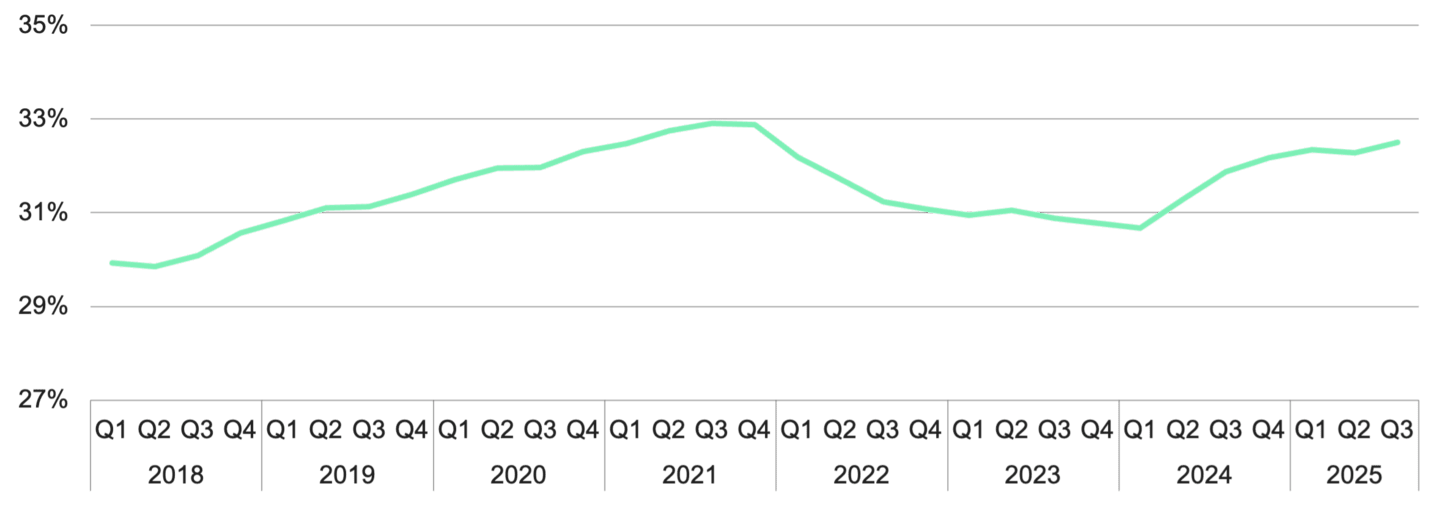
Low default rates in the high-yield asset class also highlight the healthy state of corporate balance sheets. Default rates among high-yield corporate bonds and leveraged loans have remained near historical lows, as Figure 4 demonstrates. This positive backdrop is largely due to both sectors maintaining access to capital markets for refinancings.
Figure 4 | High-Yield Securities Display Low Default Rates
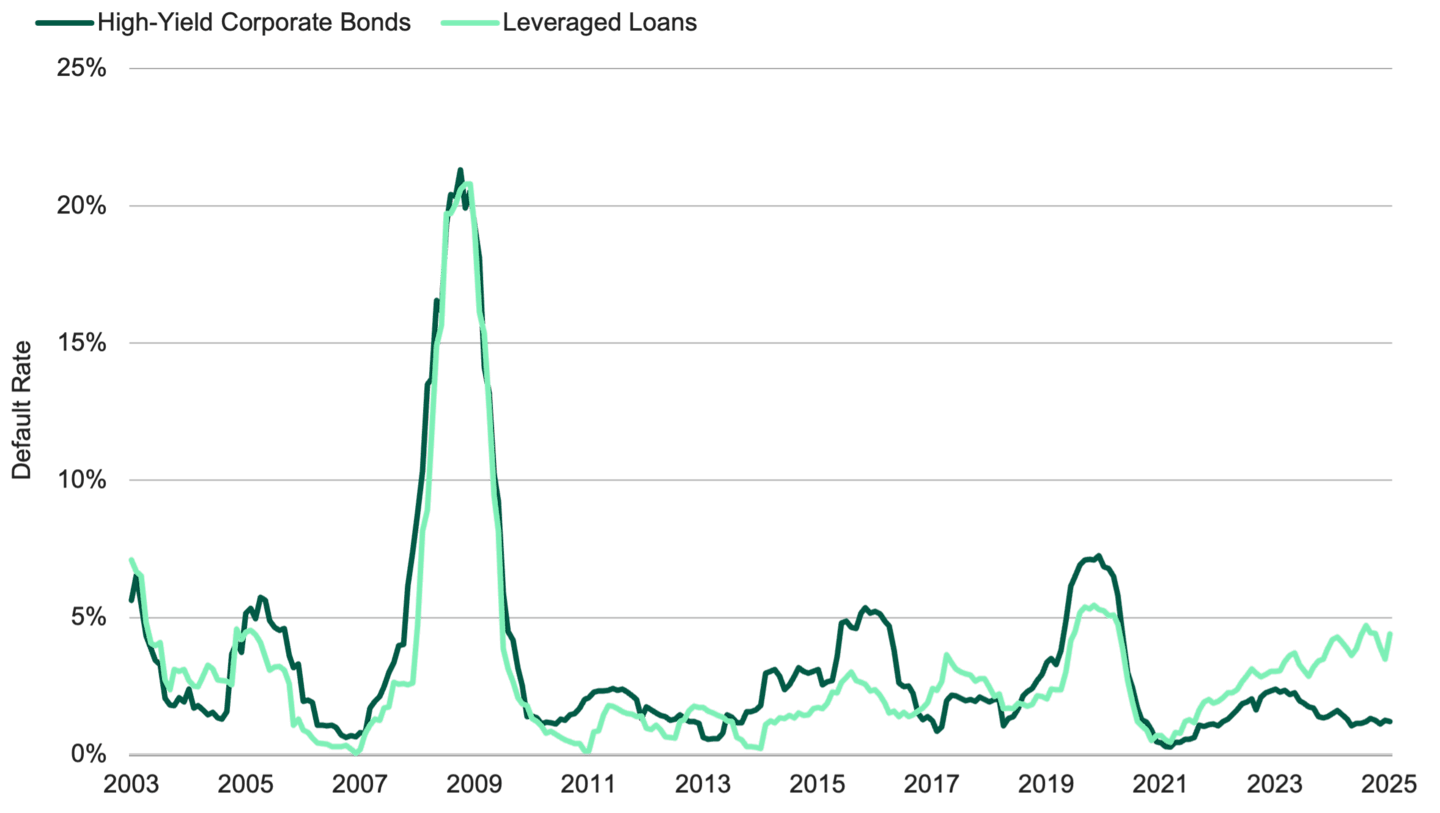
Data from 12/31/2003 – 12/31/2025. Source: BofA Global Research.
Supply Dynamics and What They Can Mean for Active Managers
The supply of debt is a key gauge of credit market health. The market projects gross investment-grade corporate bond issuance could top $2 trillion in 2026, up from $1.7 trillion in 2025.2
We expect mandatory deals — such as M&A financing and capital expenditures from large cloud service providers — to create attractive entry points, often at discounts. In our view, these dynamics should favor active managers over passive strategies as spreads adjust to new issuance.
We believe active management is crucial to uncovering promising corporate bonds across market environments and unlocking attractive performance potential for fixed-income investors. Conversely, passive portfolios are beholden to a static market index, limiting opportunities to boost return potential and manage risk exposure, in our view.
Authors
Explore Our Fixed-Income ETF Lineup
Rising stars are high-yield-rated bonds that investors believe could receive upgrades to investment-grade status.
Securities Industry and Financial Markets Association.
The opinions expressed are those of American Century Investments (or the portfolio manager) and are no guarantee of the future performance of any American Century Investments portfolio. This material has been prepared for educational purposes only. It is not intended to provide, and should not be relied upon for, investment, accounting, legal or tax advice.
Diversification does not assure a profit nor does it protect against loss of principal.
Investment return and principal value of security investments will fluctuate. The value at the time of redemption may be more or less than the original cost. Past performance is no guarantee of future results.
Generally, as interest rates rise, the value of the bonds held in the fund will decline. The opposite is true when interest rates decline.
Exchange Traded Funds (ETFs): Foreside Fund Services, LLC - Distributor, not affiliated with American Century Investment Services, Inc.