ETFs Defying Gravity: Record Inflows Drive Another Chart-Topping Year
The exchange-traded funds (ETFs) industry soared to new heights in 2025, experiencing unprecedented growth in assets, flows and product launches. What ETF market trends emerged to shape another record-breaking year?

Key Takeaways
U.S. ETF industry assets under management reached an all-time high of $13.46 trillion at year-end.¹
The growth of active ETF assets nearly doubled the rate of the industry as a whole.¹
American Century Investments' ETF platform surpassed $100 billion in assets in the early days of 2026.
What Were the ETF Industry’s Biggest Wins in 2025?
The U.S. ETF industry set several extraordinary records in 2025. Investors have clearly accelerated their embrace of the vehicle’s lower costs, tax efficiency and investment flexibility.
U.S. ETF assets under management rose to a record $13.46 trillion at year-end. With the support of strong equity and fixed-income markets, assets were up 30% year over year from the end of 2024’s $10.33 trillion.
Net new ETF flows topped $1.46 trillion, exceeding 2024’s annual flow record by 32%.
An all-time high of 1,138 new ETFs began trading in 2025, bringing the total of primary listings to 4,977.
Flows Have Favored ETFs Since 2015
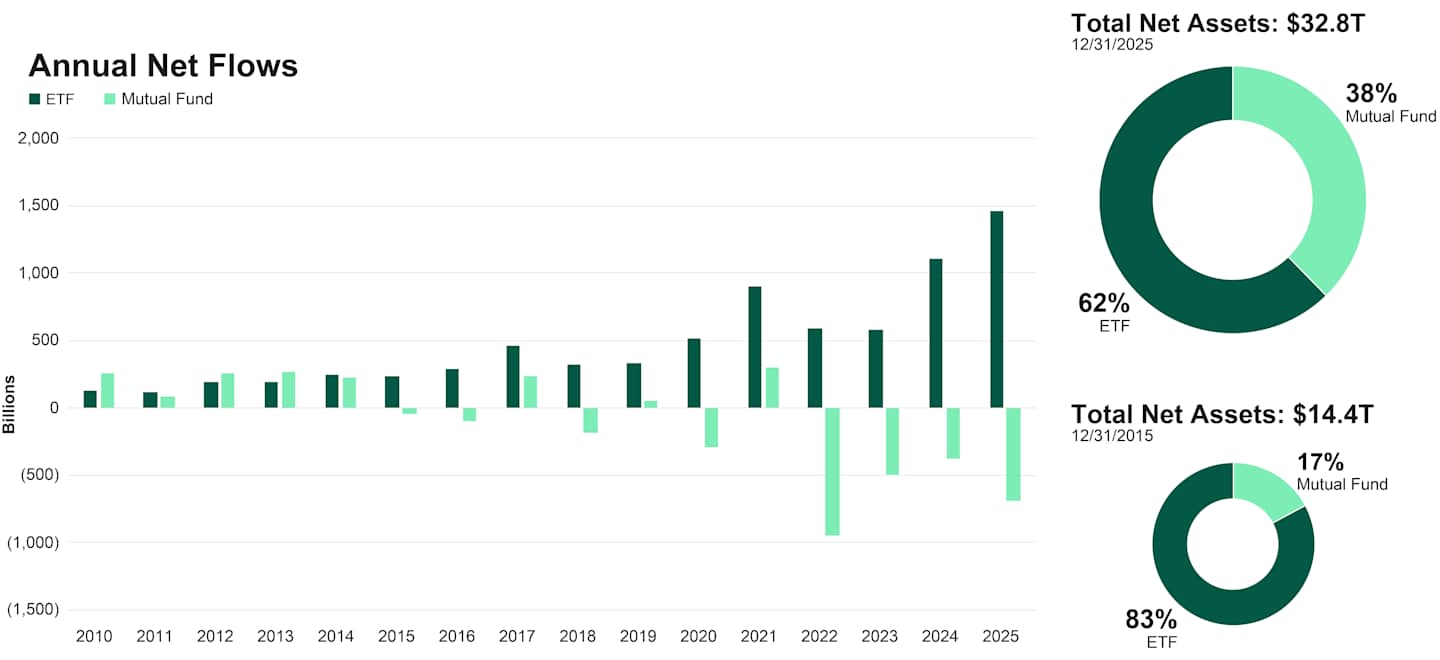
Data as of 12/31/2025. Source: Morningstar Direct Asset Flows Module (excludes money market and FOFs).
Are Active ETFs Growing Faster Than Passive ETFs, and What’s Driving the Growth?
The compound annual growth rate of active ETF assets topped 59% over the last three years—nearly double the rate of the industry as a whole. In various respects, ETFs have evolved beyond their initial function of being predominantly associated with passive index strategies.
Active ETFs (defined as ETFs that do not track an index) expand the benefits of the ETF vehicle by offering the potential for outperformance and risk mitigation, a broader investment opportunity set and the avoidance of arbitrary index rules and concentration.
Active ETFs by the numbers:
Active ETFs now total $1.47 trillion in assets under management (AUM), representing 11% of total ETF assets.
Active ETFs received record flows of $459 billion in the calendar year, representing 31% of net new flows into ETFs overall.
A record 962 new active ETFs launched in 2025, representing 85% of ETF launches for the year, and the number of active ETFs exceeded passive ETFs for the first time.
American Century Investments' ETF platform, which includes our Avantis Investors® ETFs, ended the year just shy of $100 billion in assets, a significant milestone that the firm surpassed in the early days of January 2026. We’re a top 5 active ETF issuer in AUM.*
* Morningstar data out of 384 ETF issuers overall and 344 active ETF issuers, as of December 31, 2025.
Did U.S. Stocks Lose Their Edge Over International Markets in 2025?
International diversification worked in 2025. Non-U.S. stocks meaningfully outperformed U.S. stocks for the first time since 2022. The MSCI ACWI ex USA, which combines non-U.S. developed and emerging markets equities, outpaced the S&P 500® Index by 14.5% in 2025—the highest margin of outperformance in the past 15 years.
As non-U.S. markets rebounded, ETF assets and net flows followed:
International equity ETF assets under management climbed 45%, ending the year at $1.9 trillion across developed and emerging markets, with net new flows of $216 billion.
Assets in active international ETFs nearly doubled year over year on flows nearing $60 billion.
Demand rose for Avantis Investors’ international equity strategies:
- Avantis Investors Emerging Markets Equity ETF (AVEM) attracted $6.1 billion in flows in 2025.
- Avantis International Small Cap Value ETF (AVDV) took in $5.2 billion in flows.
- Avantis International Equity ETF (AVDE) took in $4.1 billion in flows.
Did Fixed-Income ETFs Achieve Record Inflows in 2025?
Amid an environment of elevated starting yields relative to recent history and solid total returns across the interest rate and credit-risk spectrums, active and passive fixed-income ETFs attracted record inflows in 2025.
Fixed-income ETF assets ended the year at $2.27 trillion, an increase of over 26% from year-end 2024.
Fixed-income ETFs attracted $433 billion—30% of net new flows—an increase of nearly 50% from the prior year.
Why Has Interest in Active Fixed-Income ETFs Increased?
Recent interest rate volatility and heightened uncertainty have highlighted the ability of active managers to help enhance and diversify bond portfolios. Active fixed-income ETFs typically offer a broader investment universe than is defined by index constraints along with the flexibility to manage duration, yield curve positioning and credit selection. Learn more about the drawbacks of passive fixed-income strategies.
Active fixed-income ETFs by the numbers:
Assets in active fixed-income ETFs neared the half-trillion-dollar level, ending the year at $487 billion and attracting 39% of the net new flows into fixed income last year.
Assets in actively managed municipal bonds (munis) nearly doubled year over year, and flows into active muni ETFs exceeded those to passive strategies.
Within taxable bonds, ultrashort bond strategies retained the top spot by assets and continued to see strong demand, while multisector bond and diversified securitized bond strategies saw strong asset growth rates and flows.
How Does the Record Number of New ETF Launches in 2025 Impact Investor Due Diligence?
The surge of innovation and product launches has led some commentators to note that there are now more ETFs in the U.S. than there are stocks. Neither the number of ETFs nor the fact that they now exceed the number of stocks, in and of themselves, is a concern; after all, there are many more songs than there are notes. But the sheer volume of new launches certainly makes it more challenging for investors to sort through the options.
Many of the most novel strategies entering the market require additional due diligence beyond the limited track records. For example:
ETFs employing leverage or derivative instruments to achieve certain outcomes may come with premium pricing along with complexity.
Single-stock ETFs (some of which also combine with leverage) are not built for diversification.
ETFs pushing the boundaries of financial engineering seeking to generate outsize distributions may not deliver the outcomes that investors anticipate.
Two-Thirds of American Century Investments' Active Offerings Showcase a 3-Year Track Record
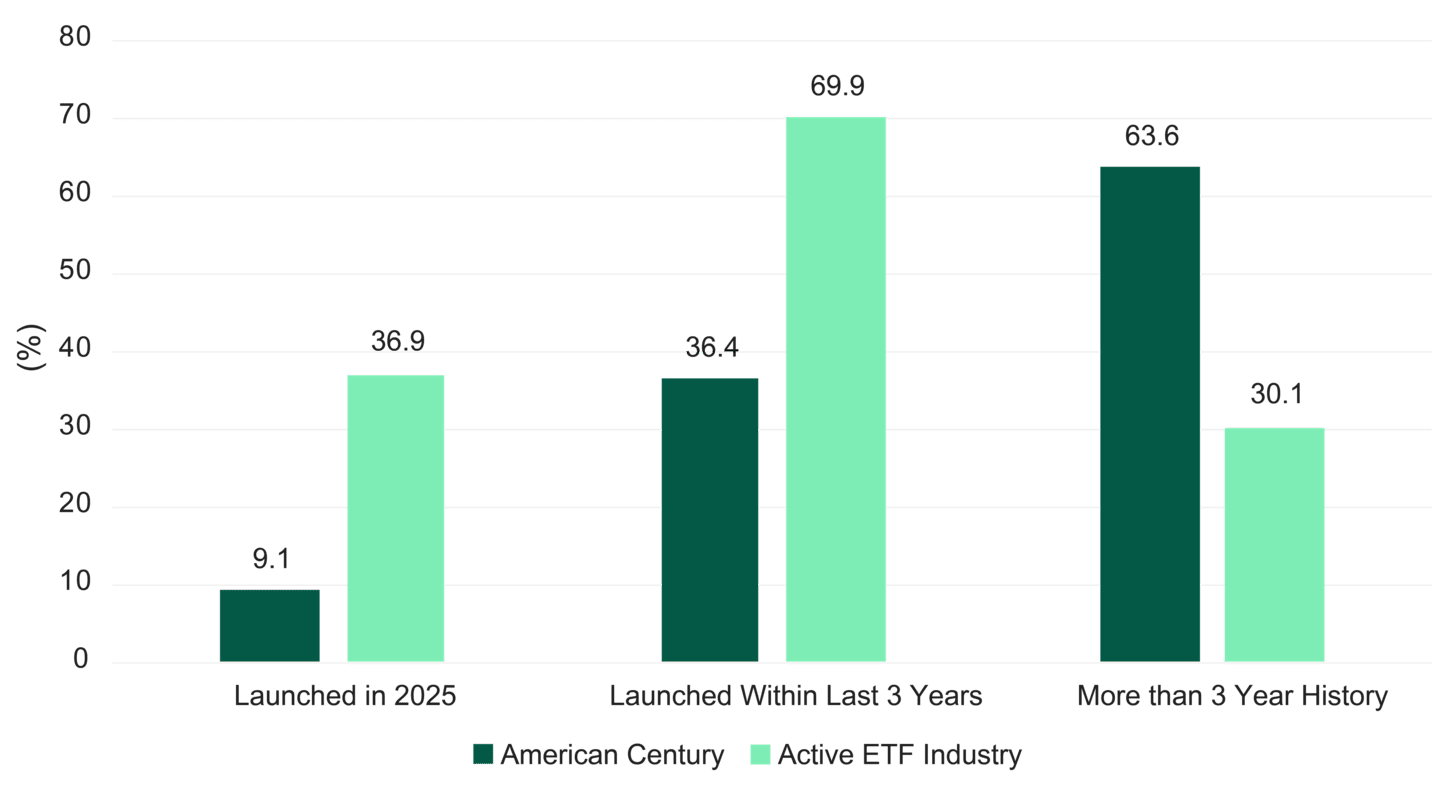
Source: Morningstar Direct as of 12/31/2025. American Century Investments inclusive of Avantis Investors ETFs. Based on inception date except for strategies converted from mutual funds, which are based on date of conversion to ETF. Total active ETFs include fund of funds (FoF) and feeders.
What Does the Multishare Class Structure Mean for the Growth of ETFs?
The Securities and Exchange Commission's approval to allow mutual funds to offer an ETF share class puts the responsibility on advisors to understand whether an ETF that’s connected to a mutual fund pool of assets will be as efficient from a tax and total cost perspective as an ETF that’s managed as a segregated, stand-alone vehicle.
While the infrastructure underlying the multishare class structure is still in development, it has the potential to be another accelerator of ETF launches and may lead to the acceleration of asset migration from mutual funds to ETFs in the coming quarters.
Authors
Head of ETF Product and Strategy
Active ETFs from American Century Investments®
It began in 2018 with a launch that included one of the first active fixed-income ETFs. We introduced Avantis Investors in 2019, blending the consistency of indexing with the potential for outperformance through active management.
Today, our lineup offers investors varying levels of active management, leveraging both in-depth fundamental research and advanced quantitative methodologies.
¹ Asset and flow data sourced from Morningstar Direct asset flows module ex-fund of funds, ex-feeder as of 12/31/2025.
Exchange Traded Funds (ETFs) are bought and sold through exchange trading at market price (not NAV), and are not individually redeemed from the fund. Shares may trade at a premium or discount to their NAV in the secondary market. Brokerage commissions will reduce returns.
You should consider the fund's investment objectives, risks, charges and expenses carefully before you invest. The fund's prospectus or summary prospectus, which can be obtained by visiting americancentury.com/etfs, contains this and other information about the fund, and should be read carefully before investing. Investments are subject to market risk.
IRS Circular 230 Disclosure: American Century Companies, Inc. and its affiliates do not provide tax advice. Accordingly, any discussion of U.S. tax matters contained herein (including any attachments) is not intended or written to be used, and cannot be used, in connection with the promotion, marketing or recommendation by anyone unaffiliated with American Century Companies, Inc. of any of the matters addressed herein or for the purpose of avoiding U.S. tax-related penalties.
This information is for educational purposes only and is not intended as tax advice. Please consult your tax advisor for more detailed information or for advice regarding your individual situation.
Diversification does not assure a profit nor does it protect against loss of principal.
Investment return and principal value of security investments will fluctuate. The value at the time of redemption may be more or less than the original cost. Past performance is no guarantee of future results.
These funds are actively managed ETFs that do not seek to replicate the performance of a specified index. To determine whether to buy or sell a security, the portfolio managers consider, among other things, various fund requirements and standards, along with economic conditions, alternative investments, interest rates and various credit metrics. If the portfolio manager considerations are inaccurate or misapplied, the fund's performance may suffer.
International investing involves special risks, such as political instability and currency fluctuations. Investing in emerging markets may accentuate these risks.
Generally, as interest rates rise, the value of the bonds held in the fund will decline. The opposite is true when interest rates decline.
Historically, small- and/or mid-cap stocks have been more volatile than the stock of larger, more-established companies. Smaller companies may have limited resources, product lines and markets, and their securities may trade less frequently and in more limited volumes than the securities of larger companies.
The opinions expressed are those of American Century Investments (or the portfolio manager) and are no guarantee of the future performance of any American Century Investments portfolio. This material has been prepared for educational purposes only. It is not intended to provide, and should not be relied upon for, investment, accounting, legal or tax advice.
Exchange Traded Funds (ETFs): Foreside Fund Services, LLC - Distributor, not affiliated with American Century Investment Services, Inc.
©2026 Morningstar, Inc. All Rights Reserved. Certain information contained herein: (1) is proprietary to Morningstar and/or its content providers; (2) may not be copied or distributed; and (3) is not warranted to be accurate, complete or timely. Neither Morningstar nor its content providers are responsible for any damages or losses arising from any use of this information.