The 'January Effect' and Stock Market Seasonality
Certain months of the year appear more favorable for investing than others. Some seasonal market trends even have a place in market lore. But how does the data really stack up?

Key Takeaways
The phrases "January effect", “sell in May and go away” and the “summer doldrums” have some street cred but dubious records as investing strategies.
A rise in stock market volatility (trading) is another seasonal trend that may be seen in the fall of U.S. presidential election years.
Investing driven by seasonal market trends is essentially market timing, which can lead to missed opportunities and lower returns.
Everyone would like a tried-and-true formula for buying and selling investments. The quest for a “slam dunk” trading strategy keeps people trying to spot—and profit—from patterns that may have been observed at one time or another.
Seasonal market trends are patterns that seem to turn up with the flip of a calendar page. Let’s take a closer look at a few of these trends that have entered market lore.
What Is the January Effect?
The "January effect" refers to the perception that the stock market rises in January more than in any other month. Academics decades ago called attention to the pattern, and explanations for it have changed over time.
In recent years, tax-loss harvesting is the most frequent cause cited for the January effect. The theory is that after selling some of their stocks at year-end for tax purposes, investors look for buying opportunities in January. (Tax-loss harvesting activity typically picks up between October and December, although it's a year-round tax-mitigation strategy.)
Similarly, investors reengaging in the market and rebalancing portfolios after the holiday season may be another source of bullish January behavior. However, the record shows both good and bad Januarys for investing, with no statistically repeatable pattern to base a trading strategy on.
January had the highest total return for the year in only four of the past 20 years (2012, 2013, 2018, 2019).¹
Sell in May and Go Away
The financial adage to sell stocks in May encourages investors to avoid the possibility of market decline over the summer and fall and then reinvest in November. However, your account balance might be higher if you stay invested even through the market’s worst days. One of the most remarkable bull runs in market history began in March 2009 after the Great Financial Crisis.
From May through October 2009, the S&P 500® Index increased approximately 20%.²
How does the Sell in May and Go Away theory hold up in today’s markets? Dive deeper into stock market performance during summer months.
The phrase sell in May is related to another seasonal market trend: the summer doldrums.
What Are the Summer Doldrums?
The tendency for market activity to slump from June through August dates back centuries when London bankers and merchants left the city and spent summer months in the country.
There is some modern-day merit to these so-called doldrums. The S&P 500 Index often experiences some of its lowest trading volume2 of the year at the height of the summer vacation season, from the week leading up to the U.S. Fourth of July holiday through the Labor Day holiday the first week of September. (Another dip usually occurs during the end-of-year holiday season.)
However, having fewer active buyers and sellers in the market around the major holidays is expected, and the lighter volume on its own is not meaningful.
Stock Market Vacation Mode
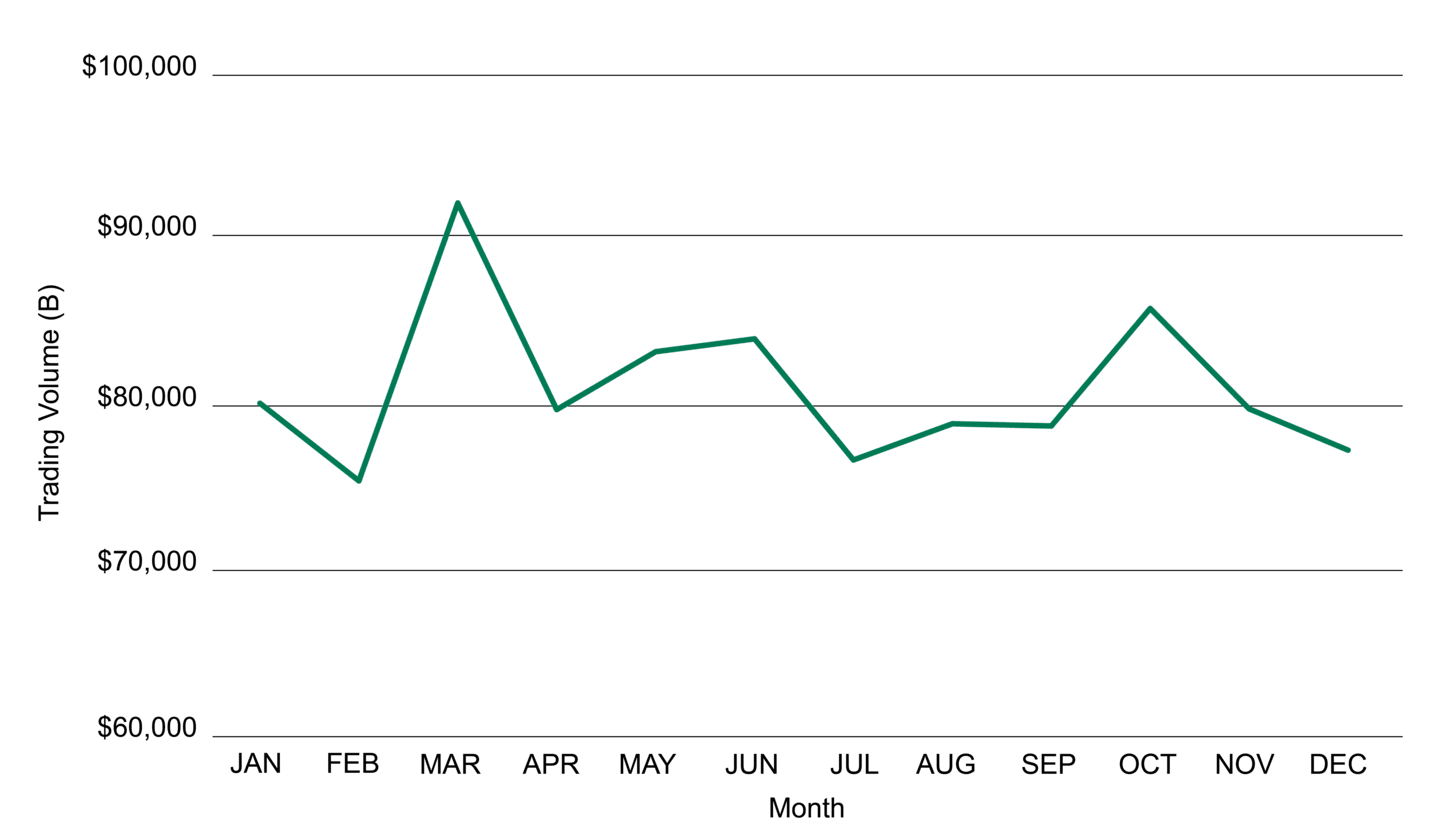
Source: finance.yahoo.com. Data as of November 2024.
Election Year Stock Market Seasonality
Another trend tied to the calendar is the U.S. presidential election cycle. Anyone paying even casual attention to the financial news hears that stock market volatility tends to increase during the run-up to Election Day and then decreases afterward.
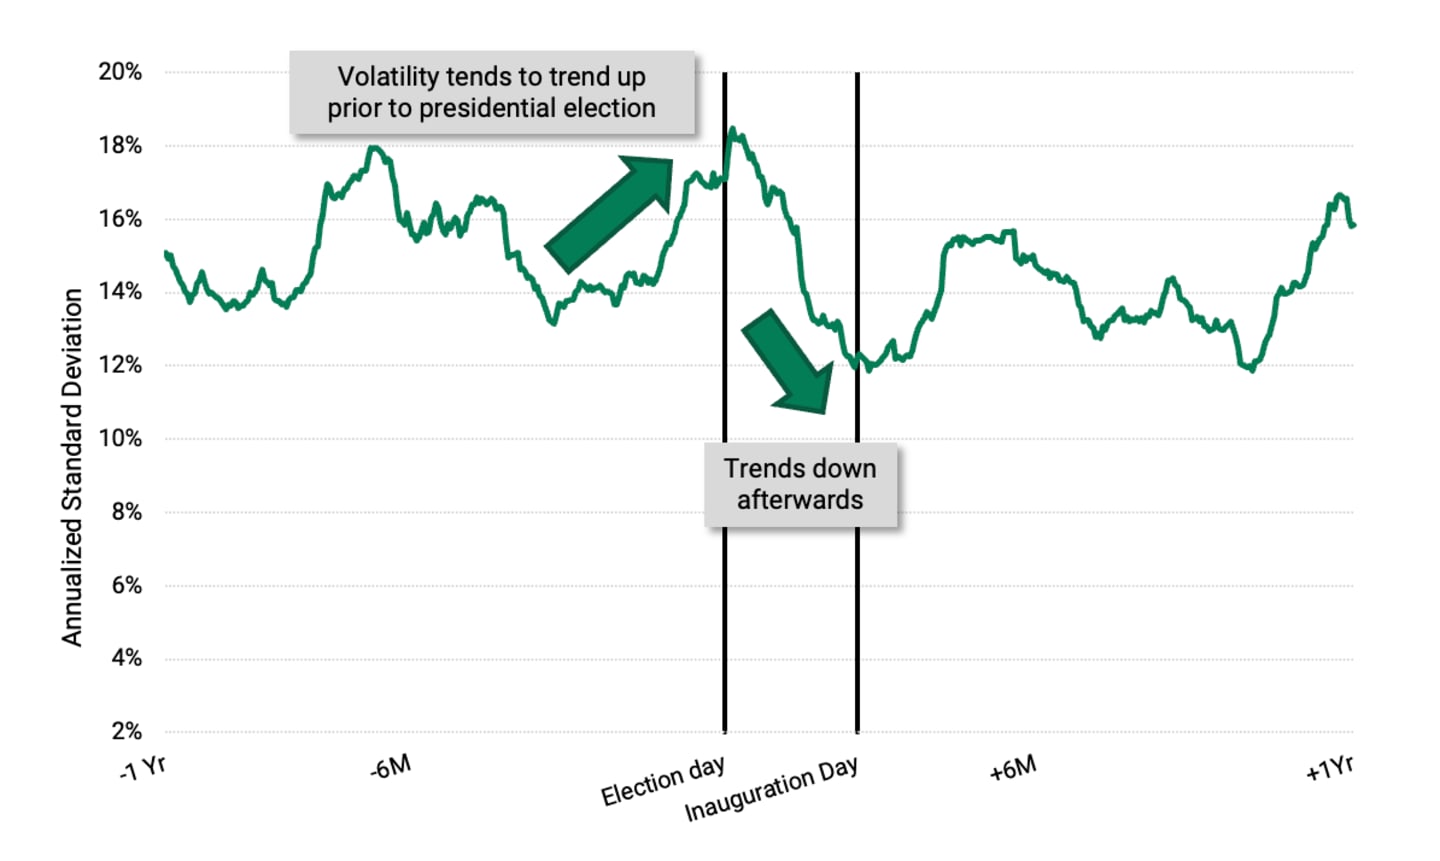
Data from 11/6/1931–11/3/2021. Source: FactSet, U.S. National Archives, Library of Congress, American Century Investments. Average annualized standard deviation of rolling 30-day S&P 500® Index price returns for 23 periods (23 elections since 1932). Time period of one year before election date through one year after election date.
Some investors might look at election year volatility and think they could gain something by trading out of markets around election time and getting back in later. However, our portfolio managers, with years of experience in the market, haven’t seen it as a winning strategy. They consistently state that election year market trends don’t affect how they select securities or make asset allocation decisions. That said, many investors, including retirement investors, don’t follow that practice.
Consider the 2024 election. Trading activity in 401(k) plans spiked over the first nine trading days of November 2024, according to employee benefits administrator Alight Solutions. Prior to the election, the firm noted investors shifting funds from equities to fixed income. However, as stocks soared on the outcome, money moved back into equities.3
“The 401(k) Index data for November shows that many 401(k) investors reacted quickly to short-term news, rather than sticking to a long-term strategy. In hindsight, it’s clear that this approach was less than ideal; investors sold low and bought high, missing out on gains.”
Rob Austin, head of thought leadership at Alight Solutions, December 11, 2024
Are Seasonal Stock Market Trends Your Friends?
Each of the trends discussed is based on a pattern observed at one time or another. But an observation is, by definition, past performance—which we all know doesn't guarantee future results. Most importantly, trading driven by seasonal market trends is a form of market timing, and no one can predict the optimal time for getting in and out of the market.
And data clearly show that getting the timing wrong—for buying or selling—can have a disastrous impact on your wallet.
Jumping In and Out of the Market May Cost Your Portfolio
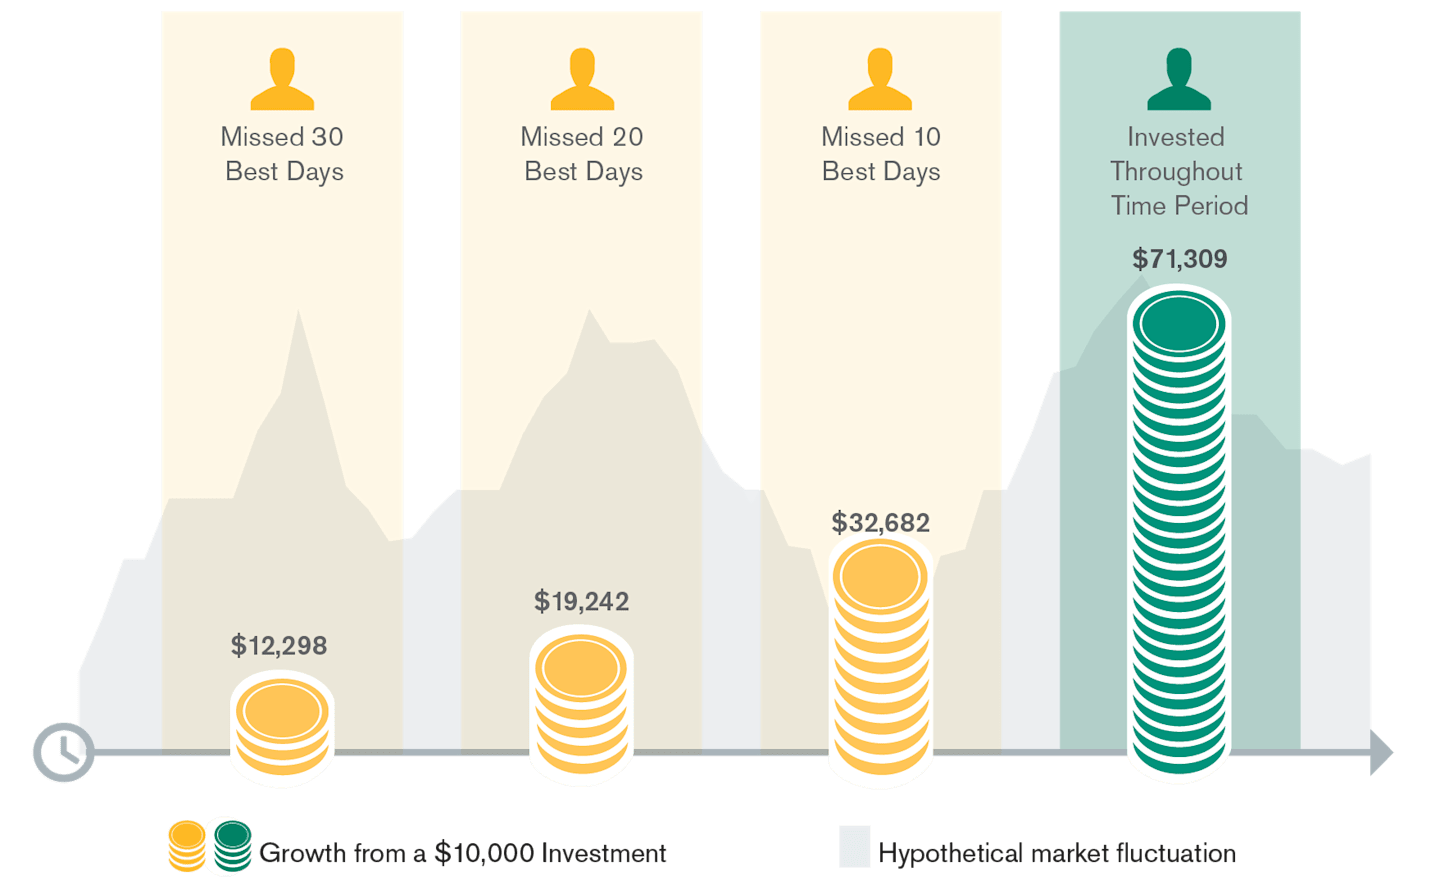
Source: FactSet. Growth of $10,000 in the S&P 500, 20-year data as of September 30, 2024. Past performance is no guarantee of future results.
This hypothetical situation contains assumptions that are intended for illustrative purposes only and are not representative of the performance of any security. There is no assurance similar results can be achieved, and this information should not be relied upon as a specific recommendation to buy or sell securities.
You might say, the trend is your friend—until it ends.
So When Should You Buy Stocks?
“Should I buy stocks now?" is one of the most common questions from clients. While some people get lucky, no one has ever been able to reliably predict the best time for getting in and out of the market.
The answer to the when-to-buy-stocks question could be dollar-cost averaging. By consistently investing, in good and bad markets, you purchase more shares when stock prices are lower and fewer shares when they are higher—giving you the opportunity to lower your average investment cost.
Dollar-cost averaging can also help you stay invested during tough market conditions and may smooth the effects of volatility on your portfolio during turbulent times.
Turn to Time-Tested Investment Strategies
It would be great if we could get out at the top of a cycle right before stocks experience a downturn and then jump back in just as prices go back up. But economic peaks and troughs are declared after they occur—and trying to time these events is more likely to have detrimental effects on investors.
Markets can change quickly for several reasons, and it’s important to be comfortable with your plan and your emotions in the face of uncertainty.
We can help you determine what's appropriate for your needs, so you can be ready for what's ahead.
Authors
Financial Consultant
‘Tis the Season for a Portfolio Check-In
We're available throughout the year to talk about your investments.
Source: MorningstarDirect. Data as of 1/15/2025.
Source: MorningstarDirect. Data as of 10/31/2024.
Lin, Natalie. Many 401(k) Investors Made Knee-Jerk Decisions on Short-Term News in November. Planadviser. December 11, 2024.
Dollar cost averaging does not ensure a profit or protect against a loss in declining markets. This investment strategy involves continuous investment in securities, regardless of fluctuating price levels. An investor should consider his or her financial ability to continue purchases in periods of low or fluctuating price levels.
Investment return and principal value of security investments will fluctuate. The value at the time of redemption may be more or less than the original cost. Past performance is no guarantee of future results.
Diversification does not assure a profit nor does it protect against loss of principal.
The opinions expressed are those of American Century Investments (or the portfolio manager) and are no guarantee of the future performance of any American Century Investments portfolio. This material has been prepared for educational purposes only. It is not intended to provide, and should not be relied upon for, investment, accounting, legal or tax advice.
American Century's advisory services are provided by American Century Investments Private Client Group, Inc., a registered investment advisor. These advisory services provide discretionary investment management for a fee. The amount of the fee and how it is charged depend on the advisory service you select. American Century’s financial consultants do not receive a portion or a range of the advisory fee paid. Contact us to learn more about the different advisory services. All investing involves the risk of losing money.
©2026 Morningstar, Inc. All Rights Reserved. Certain information contained herein: (1) is proprietary to Morningstar and/or its content providers; (2) may not be copied or distributed; and (3) is not warranted to be accurate, complete or timely. Neither Morningstar nor its content providers are responsible for any damages or losses arising from any use of this information.
©2026 Standard & Poor's Financial Services LLC. All rights reserved. For intended recipient only. No further distribution and/or reproduction permitted. Standard & Poor's Financial Services LLC ("S&P") does not guarantee the accuracy, adequacy, completeness or availability of any data or information contained herein and is not responsible for any errors or omissions or for the results obtained from the use of such data or information. S&P GIVES NO EXPRESS OR IMPLIED WARRANTIES, INCLUDING, BUT NOT LIMITED TO, ANY WARRANTIES OF MERCHANTABILITY OR FITNESS FOR A PARTICULAR PURPOSE OR USE IN CONNECTION TO THE DATA OR INFORMATION INCLUDED HEREIN. In no event shall S&P be liable for any direct, indirect, special or consequential damages in connection with recipient's use of such data or information.