Federal Debt: High and Climbing
As federal debt reaches record highs, understanding the implications for the economy, government programs and investments is crucial.

Key Takeaways
Analysts project that the government’s debt burden, which recently hit $40 trillion, will continue to grow.
Interest payments and mandatory outlays for programs like Social Security and Medicare leave little room for meaningful discretionary budget cuts.
The federal debt burden may increase borrowing costs for consumers and companies, challenge investors and jeopardize critical programs.
After years of warnings about government spending and debt — and watching the deficit continue to grow — you may be tempted to tune out. We get it. The budget numbers are large, and the timelines in some debt forecasts are so distant they may seem like something you don’t need to worry about today.
This article aims to help you understand why federal debt keeps rising, the factors driving it and how federal debt may affect you.
Why Federal Debt Continues to Rise
Federal debt grows when government spending exceeds revenue, resulting in a deficit. While economic conditions, tax policies and spending priorities change over time, the U.S. has recorded budget deficits in most years for the last several decades.
Several factors contribute to ongoing deficits, including spending on Social Security, Medicare and Medicaid. Interest payments on existing federal debt and government responses to economic downturns or other priorities also increase the debt level.
Over the last year, the total national debt grew by $82,536.74 each second.¹
The total federal debt stands at more than $40 trillion, a record high.2 The non-partisan Congressional Budget Office (CBO) estimates the annual budget deficit will reach $3.1 trillion by 2036.3
Federal Debt and Deficits: What You Need to Know
Federal Budget Surplus/Deficit
When the government spends less than it receives in revenue in a given fiscal year, it reports a surplus. Conversely, when it spends more than it collects, it reports a deficit. The primary sources of government revenue are individual and corporate taxes.
Federal (National) Debt Held by the Public
This is the total amount of money the government owes its creditors, including the American public, U.S. banks, foreign governments and investors. When the government spends more than it collects, it must borrow money by issuing Treasuries, increasing its overall debt load. Debt held by the public excludes holdings by federal agencies, most notably Social Security trust funds.
Mandatory Government Spending
This refers to ongoing spending that Congress has allocated to fund specific programs established by legislation. These programs include Social Security, Medicare, Medicaid, specific income assistance programs and other transfer payments to states and local entities.
Discretionary Government Spending
This refers to the funds Congress allocates in its annual budget process to finance various government departments and agencies, including national defense.
Interest Payments
These are the government's regular interest payments to purchasers of its bonds. When the government pays interest to avoid defaulting on its debt obligations, these payments are a form of mandatory spending.
How Government Deficits and Debt Affect You
Economists, financial analysts and investors have long warned about the negative effects of ongoing deficits and increasing government debt. Many worry that the government’s rising debt burden limits fiscal flexibility and could trigger a chain reaction of other effects.
Higher bond yields are among those potential consequences. When the government spends more than it collects in tax revenue, it must issue bonds to fund its operations. If the supply of government bonds exceeds demand, bond prices fall, and yields rise to attract additional buyers.
The ripple effect can be significant.
For example, elevated bond yields typically lead to higher borrowing costs throughout the economy. In this scenario, you could expect to pay higher interest rates for mortgages, car loans, credit cards and other consumer debt. This dynamic also makes it more expensive for companies and entrepreneurs to obtain loans to operate and grow their businesses.
Altogether, higher borrowing costs tend to inhibit economic growth.
Higher bond yields could also affect your investment portfolio. Initially, rising yields would hurt the value of your current bond holdings because bond prices and yields move in opposite directions. Longer term, however, the effect could be positive as higher yields increase the income potential of your fixed-income holdings and interest-bearing accounts.
Bond yields also may have implications for stocks. For example, if higher-quality bonds offer attractive yields, investors may demand greater return potential for taking on stock market risk. In addition, higher interest rates could weigh on corporate earnings due to increased interest expenses and borrowing costs.
You can work with your advisor to develop a diversified investment strategy for navigating such an environment.
The U.S. Has A Long History of Borrowing
The federal government has borrowed money for more than two centuries. This debt has financed efforts ranging from wars to westward expansion and space exploration.
In recent years, the government has relied on debt to cover ongoing annual budget deficits. Since 1982, the U.S. has recorded a budget surplus in only four years: from 1998 to 2001.
With spending outstripping revenue, U.S. debt tripled during the 1980s and reached $10 trillion during the global financial crisis of 2007-2009. Since then, it has quadrupled, surpassing $40 trillion and growing faster than the U.S. economy.4
One way to put these large numbers into perspective is to look at debt as a percentage of the nation’s economic output, measured by gross domestic product (GDP). As shown in Figure 1, total federal debt as a percentage of the U.S. economy has been climbing since 2001 and is now around 125%.
Figure 1 | Total Federal Debt Is Larger Than the U.S. Economy
U.S. Federal Debt as a Percent of GDP
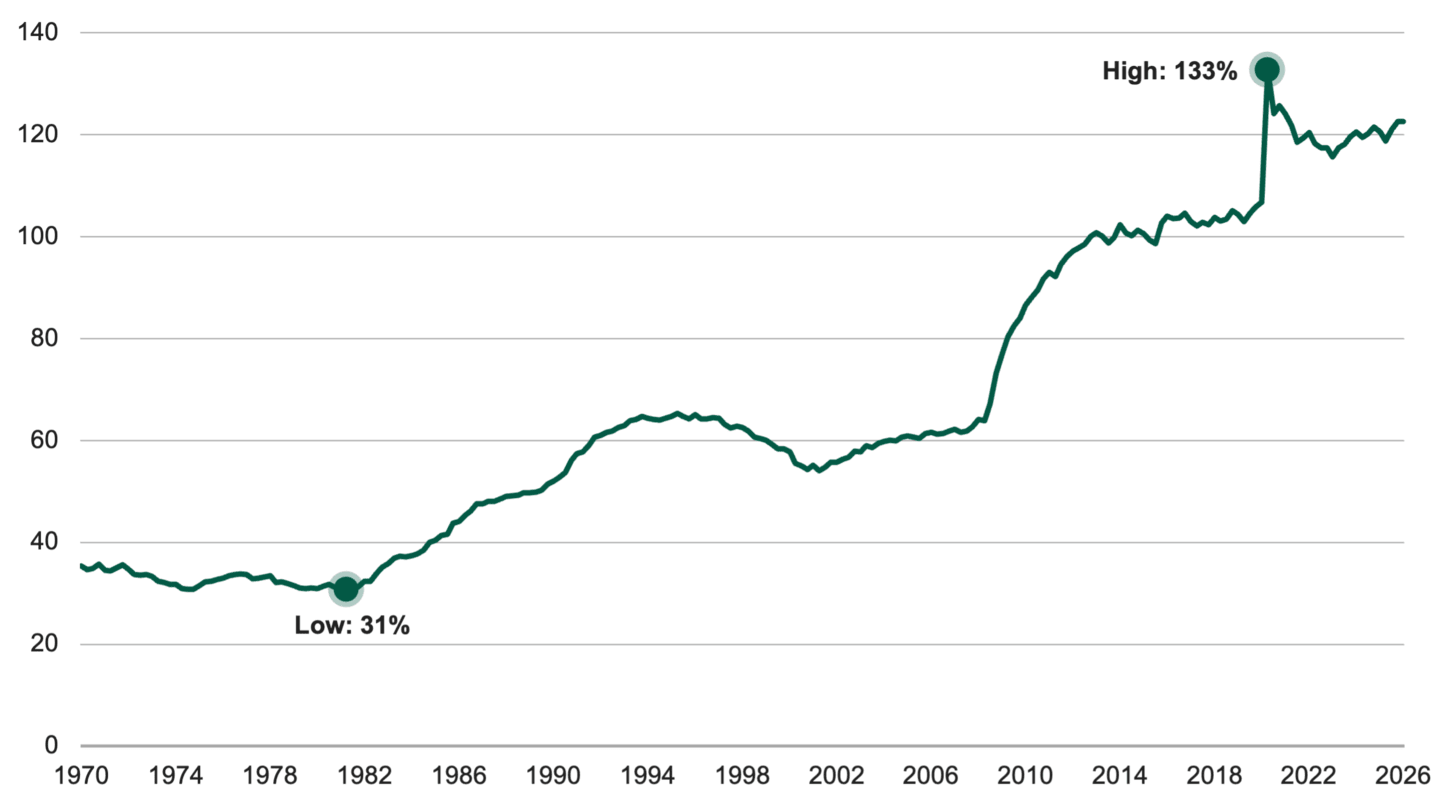
Data from 1/1/1970 – 1/1/2026. Source: Federal Reserve Bank of St. Louis.
How Mandatory Spending Drives Federal Debt
CBO projections show mandatory federal spending on programs like Social Security and Medicare will remain the primary driver of the escalating federal debt. Plus, interest payments account for an increasing portion of annual government expenditures.
In 2024, mandatory spending accounted for 61% of the federal budget, with interest payments accounting for another 13%. This marked the first time the government spent more on interest payments than on funding national defense.5
The CBO forecasts that by 2035, mandatory spending and interest will consume an even larger portion of the federal budget, further limiting discretionary spending.
Given this mandatory spending, the government's ability to reduce the budget through discretionary spending cuts is becoming increasingly limited. Even if the government eliminated all discretionary spending, it would still face a deficit this year.
Why Does Congress Raise the Debt Ceiling?
The U.S. debt limit represents the total amount of money Congress has authorized the government to borrow to meet its existing legal obligations. At more than $36 trillion, the national debt was nearing its ceiling before Congress raised the lid on borrowing by another $5 trillion in 2025.
The U.S. government has never defaulted on its debt, so a near-term default is highly unlikely. Congress has always raised or suspended the debt ceiling when the government reaches its borrowing limit. In fact, since 1960, Congress has extended or suspended the debt ceiling 79 times.6
Figure 2 | The Debt Ceiling Was Set at $41.1 Trillion in 2025
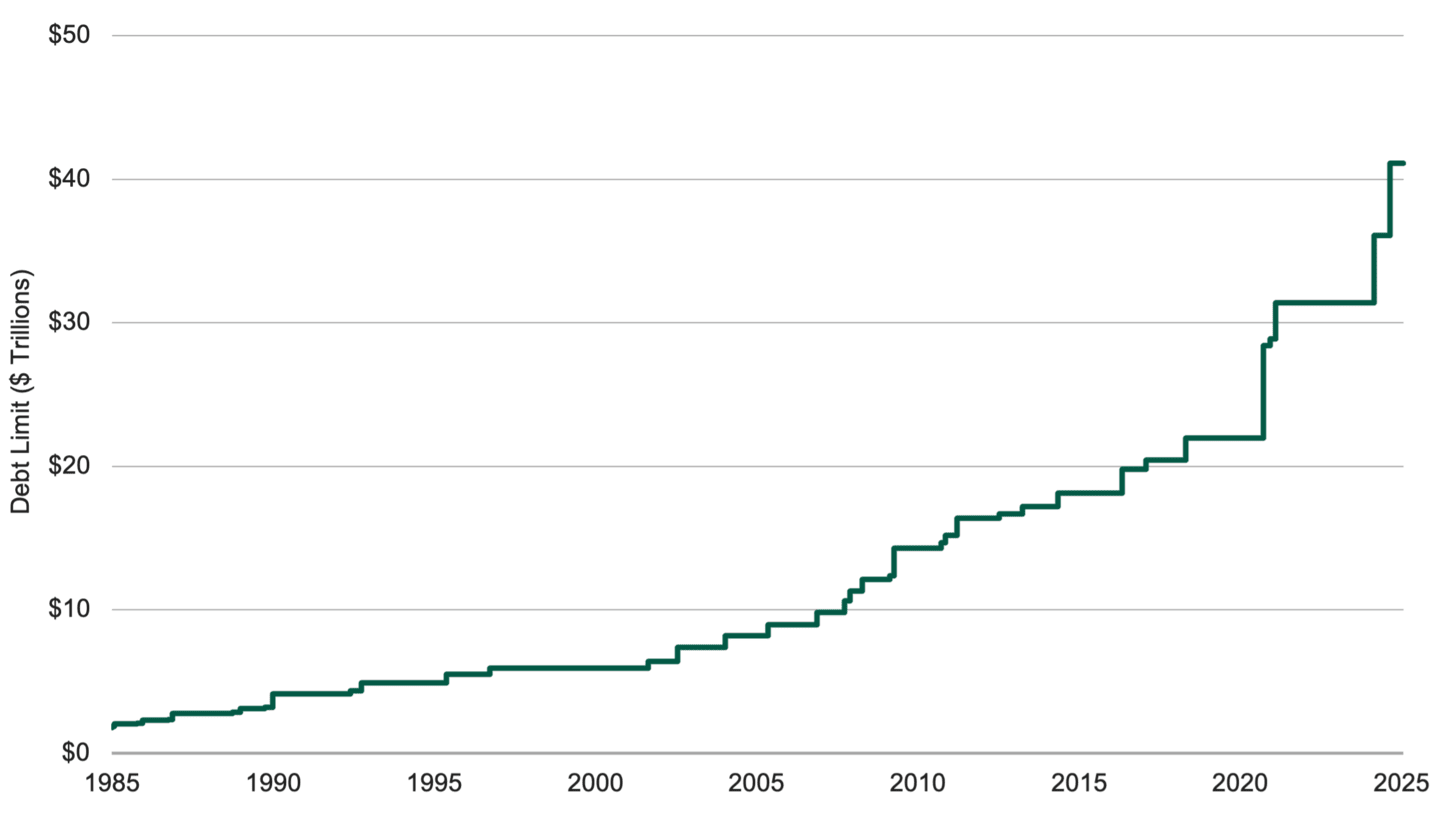
Data from 11/14/1985 – 7/4/2025. Source: Office of Management and Budget and Peter G. Peterson Foundation. The previous limit is shown for periods the debt limit was suspended.
Will Rising U.S. Debt Deter Investors?
Rising debt could certainly raise the government’s borrowing costs. The global bond market uses U.S. Treasuries to help set yields for other forms of debt. This could lead to higher yields across all types of debt, which may chill borrowing demand for ongoing investments.
It’s happened before. From 1985 to 1993, federal spending rose by 49%.7 Worried bond investors finally had enough. Their reluctance to invest in federal debt sent the yield on the 10-year U.S. Treasury note to 8% in late 1994, up from 5.4% a year earlier.8
In 2026, $9.7 trillion in federal debt is set to mature.9 That’s nearly double the revenue the federal government collected in fiscal 2026.10
The 10-year U.S. Treasury note yield was 5.1% as of September 24 — the highest it’s been since 2007.11 Reissuing this maturing debt will be more expensive than the initial cost.
What Comes Next for U.S. Federal Debt?
In addition to being daunting, the federal debt level has far-reaching economic implications. Mounting debt creates a significant long-term headwind that can pressure interest rates, stifle economic growth and fuel market volatility.
There’s no easy or quick solution to reduce the federal debt. But keeping a close watch on federal budgets and spending can help you prepare for the potential effects on your investments and finances.
Authors
How do politics and government policies affect your money?
David Schweikert, “Debt Dashboard,” Joint Economic Committee Republicans, September 18, 2026.
U.S. Department of the Treasury, “Debt to the Penny,” accessed September 18, 2026.
Congressional Budget Office, “The Budget and Economic Outlook: 2026 to 2036,” February 2026.
U.S. Government Accountability Office, “The Federal Government’s Debt Is Growing Faster Than the Economy. What Does that Mean for You?” June 11, 2026.
Benn Steil and Elisabeth Harding, “For the First Time, the U.S. Is Spending More on Debt Interest Than Defense,” Council on Foreign Relations, May 23, 2024.
U.S. Department of the Treasury, Policy Issues, “Debt Limit,” accessed May 19, 2025.
St. Louis Federal Reserve Bank, “Historical Tables, Budget of the U.S. Government, Fiscal Year 1996.”
Macro Trends, “10-Year Treasury Rate - 54 Year Historical Chart,” May 15, 2025.
James R. McTigue, Jr., “Federal Debt Management: Treasury Is Meeting Borrowing Needs but the Deteriorating Fiscal Outlook Poses Risks,” March 31, 2026.
FiscalData, “How much revenue has the U.S. government collected this year?” U.S. Department of the Treasury, accessed September 24, 2026.
Federal Reserve Economic Data, “Market Yield on U.S. Treasury Securities at 10-Year Constant Maturity, Quoted on an Investment Basis,“ Federal Reserve Bank of St. Louis, accessed September 24, 2026.
The opinions expressed are those of American Century Investments (or the portfolio manager) and are no guarantee of the future performance of any American Century Investments portfolio. This material has been prepared for educational purposes only. It is not intended to provide, and should not be relied upon for, investment, accounting, legal or tax advice.
Diversification does not assure a profit nor does it protect against loss of principal.
Investment return and principal value of security investments will fluctuate. The value at the time of redemption may be more or less than the original cost. Past performance is no guarantee of future results.