Expose the ‘Hidden’ Tax Cost That Can Hurt Fund Returns
Managing tax-cost ratios can make portfolios more tax savvy.


Key Takeaways
The largest fund-related fee facing your clients may be the “hidden” fee of taxation.
A fund’s tax-cost ratio indicates the portion of returns lost to federal income taxes.
Our proprietary tool can help improve tax efficiency in your clients’ portfolios.
Most of the costs associated with professionally managed mutual funds and ETFs are easy to uncover and analyze. Investment advisors routinely break down each fund’s annual operating expenses, including management fees, distribution and service fees and other management-related expenses.
But there’s another cost that’s not outlined in a fund’s prospectus and can have meaningful effects on your clients’ investment returns—taxes.
Taxes can take an even bigger bite out of investment returns than annual fund operating expenses. Mutual funds and ETFs must distribute dividends and capital gains. The amount of those distributions can vary widely between strategies and even among funds with similar objectives. Your clients will pay taxes on any distributions that occur in non-tax-advantaged accounts.
What’s the Tax-Cost Ratio?
The tax-cost ratio is the percentage loss on a fund’s annual return due to the taxes investors may pay on their funds’ distributions. It measures the potential tax “drag” on a taxable investment’s return.
The IRS requires shareholders investing outside of tax-advantaged retirement structures to report portfolio income in the year the shareholders receive it. Different types of portfolio income are subject to different federal income tax rates1:
Different Tax Rates for Different Income Types
Portfolio Income Type | Top Federal Income Tax Rate: 40.8%2 | Top Federal Capital Gains Tax Rate: 23.8%2 | Top Federal Income Tax Rate: 0% |
Short-term capital gains | ● | ||
Long-term capital gains | ● | ||
Interest income | ● | ||
Nonqualified dividends | ● | ||
Qualified dividends | ● | ||
Municipal bond interest3 | ● | ||
Unrealized capital appreciation | ● |
Source: American Century Investments
The tax-cost ratio considers all these distribution types to estimate how much a fund’s annualized return is reduced by income taxes investors pay. Funds with consistently high tax-cost ratios are generally less tax efficient than funds with lower ratios.
For example, assume a fund’s tax-cost ratio for a three-year period was 2%. Investors in that fund lost an average 2% of their investment to taxes over the same period. That’s in addition to the operating fees and sales charges investors paid during that time.
American Century Investments’ proprietary tax planning tool incorporates tax-cost ratio4 as a key input to create an apples-to-apples comparison among different strategies.
More Distributions, More Money Forfeited to Taxes
In general, the more distributions a fund makes means more money is forfeited to taxes—
resulting in a higher tax-cost ratio.
One way to help reduce the tax burden while maintaining an investment’s purpose in a portfolio is to consider ETFs for tax-sensitive investors. Features of the ETF structure improve tax efficiency, which have enabled ETFs to generally distribute fewer capital gains than their mutual fund counterparts.
American Century Investments® and Avantis Investors® offer a broad lineup of ETFs.
In 2022, half of all U.S. mutual funds distributed capital gains, compared with only 4% of ETFs, as Figure 1 demonstrates.
Figure 1 | Half of All Mutual Funds Distributed Capital Gains in 2022
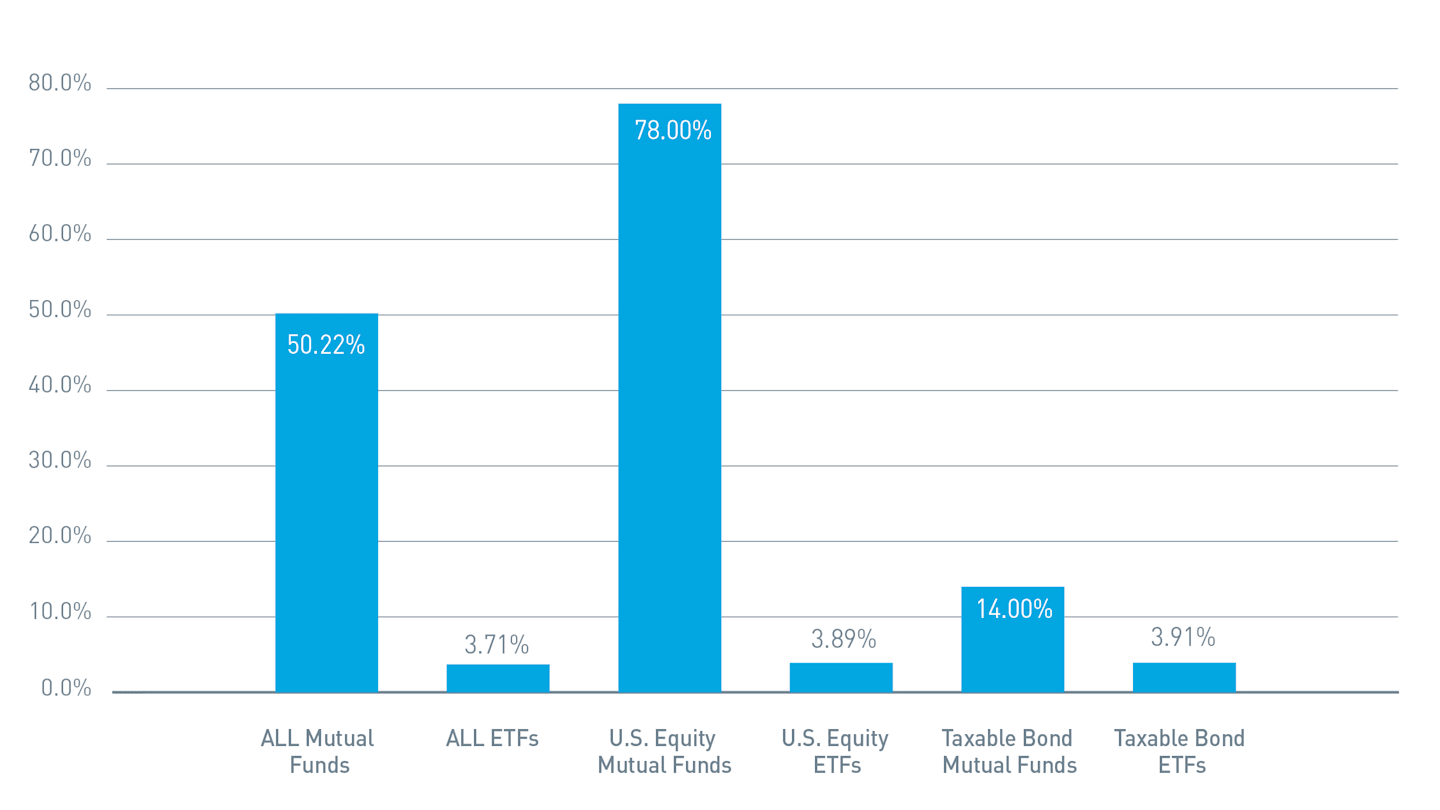
As of December 31, 2022. Funds and ETFs with inception prior to 1/1/ 2022. Source: Morningstar
Many investors actively seek portfolios with low expense ratios to minimize costs. Yet, the average tax-cost ratio of a fund category often is much larger than the average expense ratio. For investors in those higher tax-cost ratio funds, taxes took a bigger bite out of returns than fund expenses did.
Figure 2 compares the expense ratios and average tax-cost ratios of different asset classes and vehicles.
Figure 2 | Tax Impact Can Exceed Expense Impact: ETFs May Provide Some Relief
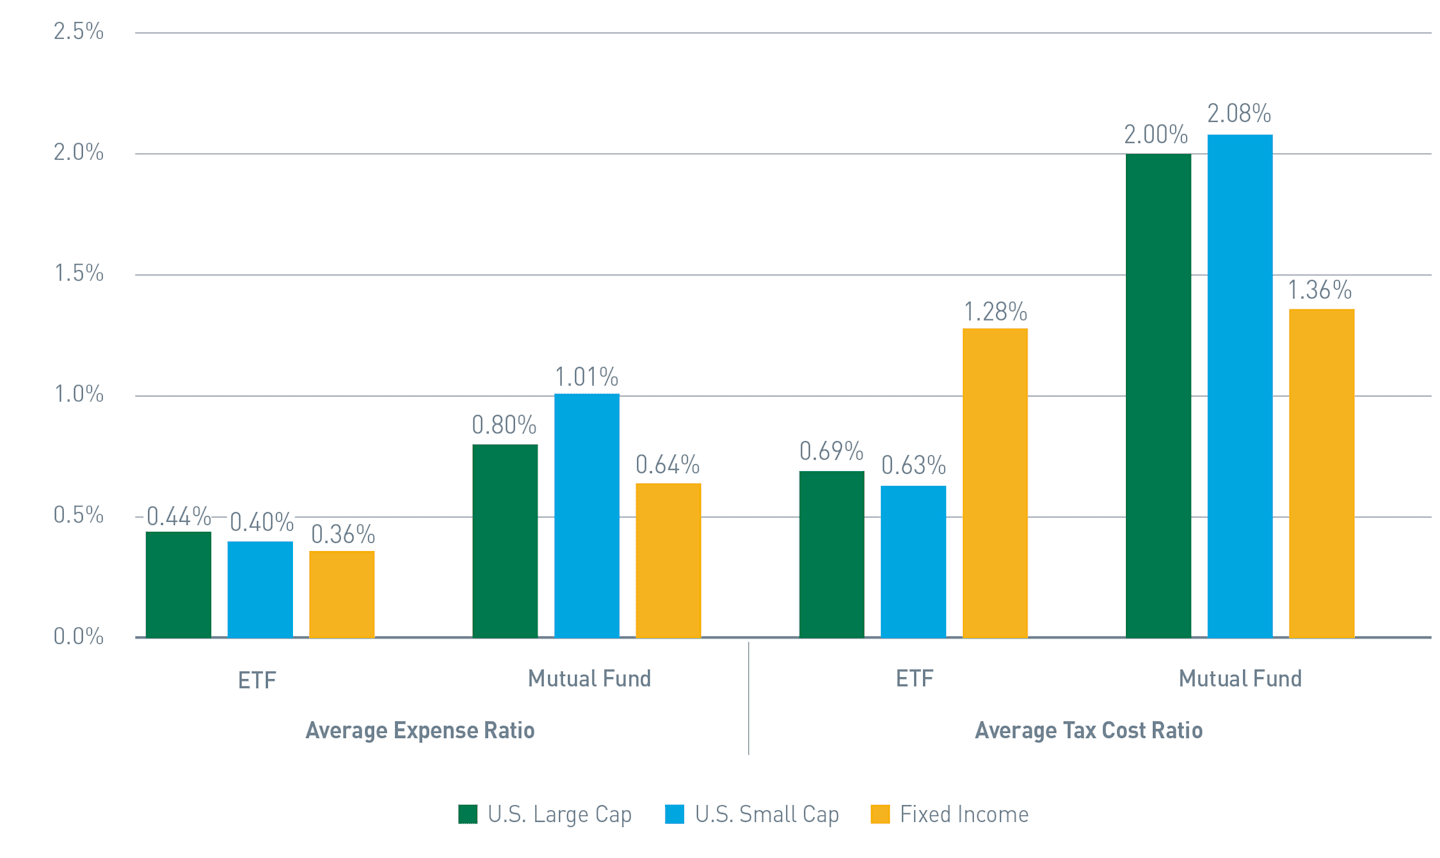
Data as of December 31, 2022. Source: Morningstar.
Figure 2 also illustrates another point: The way portfolio income types are taxed can influence results. For example, taxable fixed-income strategies play an important income-generating role for investors (among other goals), but that income is taxed at the top federal rates. Taxable fixed-income ETFs can help defray some of those costs through lower expense ratios and improved tax-cost ratios.
Another way to help reduce the tax burden may be to consider where certain types of investments reside within an overall portfolio. Holding taxable fixed-income funds within tax-deferred/retirement accounts and municipal bond funds in taxable accounts may minimize taxes. Learn more about Tax Investing Strategies.
Long-Term Effects on Performance
Over time, every dollar paid in taxes is one less dollar to reinvest, which can stunt potential investment growth. Left unchecked, that “small” tax bill can diminish your clients’ investment returns. Avoiding or limiting capital gains distributions will reduce the tax-cost ratio in your clients’ portfolios and increase what they are able to keep invested.
According to Morningstar® data, U.S. large-cap equity ETF strategies5 logged an average annual return of 11.1% for the 10 years ended December 31, 2022. A $100,000 initial investment would have grown to more than $287,803 over that period, in the absence of taxes. Taxes would have reduced some portion of those earnings for investments made outside of tax-deferred structures.
Over time, the tax burden difference between mutual funds and ETFs can be significant. For mutual funds, taxes consumed an average 1.9% of returns annually over that period, while equity ETFs fared better, with taxes consuming only an average of 0.5%. With a smaller tax burden, the ETF portfolio ended the 10-year period with almost $45,000 more than the mutual fund portfolio, as Figure 3 highlights.
Figure 3 | Tax-Cost Ratio Comparison: ETF vs. Mutual Fund
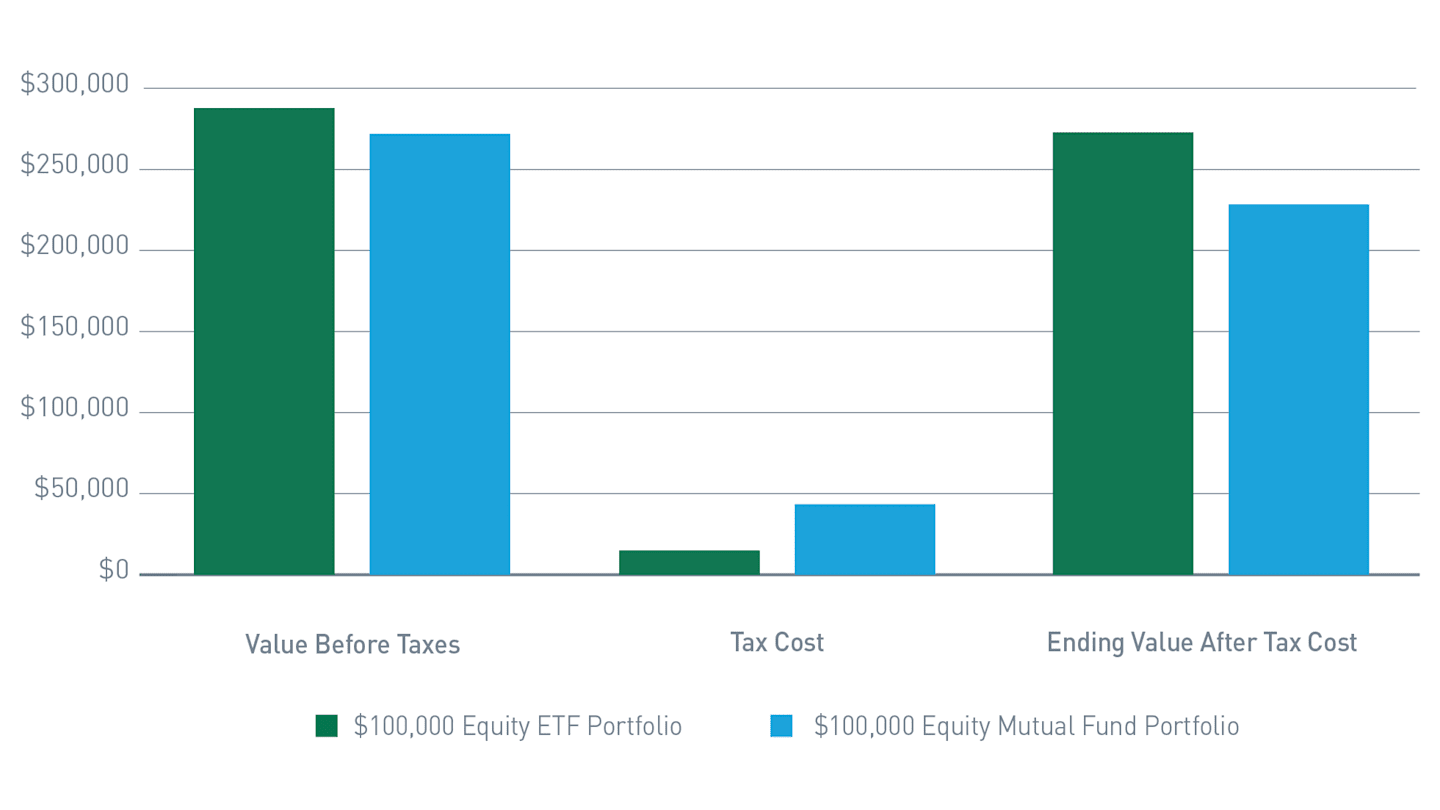
Source: Morningstar, 10-year period ended December 31, 2022. Assumes initial investment of $100,000 in U.S. large-cap equity (which consists of the average of large-cap value, large-cap growth and large-cap blend categories).
This hypothetical situation contains assumptions that are intended for illustrative purposes only and are not representative of the performance of any security. There is no assurance similar results can be achieved, and this information should not be relied upon as a specific recommendation to buy or sell securities.
What's the Difference Between Tax-Cost Ratio and After-Tax Return?
Looking at after-tax returns is a popular way to examine historical performance and tax efficiency. But doing so adds another element—sales loads—that can distort the picture.
The after-tax return calculation shows the combined effects of taxes and sales loads. Mutual funds and ETFs can have different after-tax returns, even if they have similar total returns and tax ratios. This is because mutual funds usually have sales charges. ETFs do not.
The tax-cost ratio doesn’t include sales loads and therefore isolates the effects of taxes. You can use the tax-cost ratio to compare the tax efficiency of funds, style categories, portfolio managers and time frames.
Gauge Tax Efficiency Over Time
A fund’s tax efficiency can improve or deteriorate over time. Using American Century Investments’ proprietary tax tool, lets you examine a fund’s historical tax-cost ratio to determine if a fund’s tax efficiency has improved or worsened. See Figure 4.
Figure 4 | Tax Tool Highlights Tax-Efficiency Trends
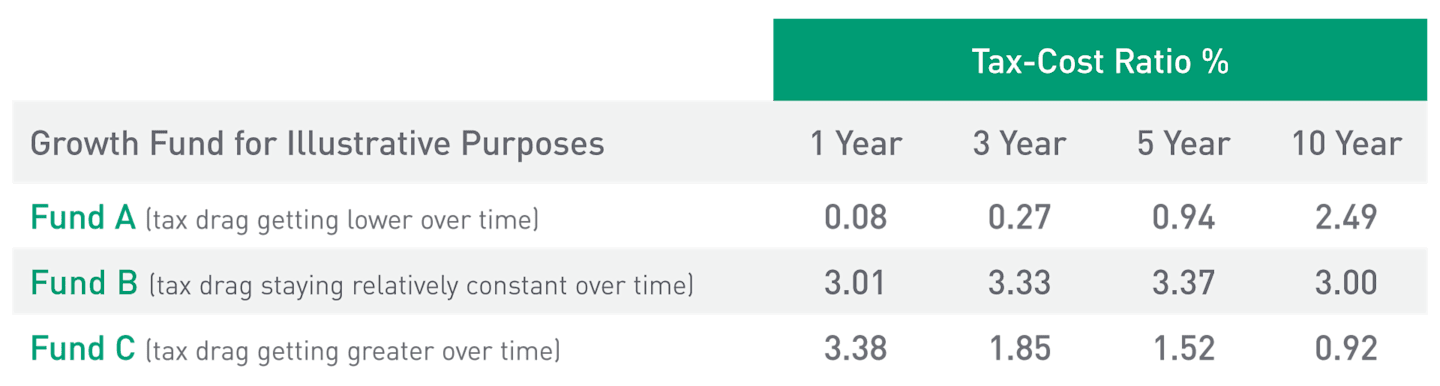
Source: American Century Investments proprietary tax planning tool and Morningstar Direct as of December 31, 2022.
Fund A’s one- and three-year tax-cost ratios are relatively low, while its longer-term ratios are relatively high. This suggests the fund manager’s ability to manage tax exposure has improved over time. Conversely, Fund C’s tax efficiency has deteriorated over time, while Fund B’s tax efficiency has remained fairly high and constant.
How Can Tax-Cost Ratios Help Me Reduce 'Tax Drag'?
Long-term investors in taxable accounts and those invested in actively managed mutual funds with consistent or large taxable distributions are most susceptible to tax drag.
Knowing how to find, interpret and manage a portfolio’s tax exposure can help you deliver better results to your clients. To help, American Century Investments offers a range of resources. Along with time-tested tips, we have a proprietary tax planning tool that enables us to identify pertinent tax-related insights specifically for your portfolios.
We invite you to learn about this complimentary tool that zeros in on current holdings and quantifies potential tax savings for clients.


Shareholders may also be subject to state taxes, which are excluded for purposes of this illustration.
Federal and capital gains tax rates include 3.8% net investment income tax (NIIT). The annual income thresholds for NIIT in 2023 are $200,000 for single filers, $125,000 for married filing separately, $200,000 for head of household, and $250,000 for married filing jointly or a qualifying widow(er) with a dependent child. Source: IRS.
The 0% rate applies if the municipal bond is issued in the taxpayer’s resident state. Otherwise, some state and local income tax may apply.
Source: Morningstar Direct. Tax-cost ratio uses the highest federal tax rates.
Represented by the average of Morningstar’s U.S. Funds Large Value, U.S. Funds Large Growth and U.S. Funds Large Blend categories, which include mutual funds and ETFs.
This material is provided for educational purposes and is not considered advice. Financial advisors assume responsibility for presenting the ideas to their clients independently from this document and assume the liability for ensuring suitability.
The opinions expressed are those of American Century Investments (or the portfolio manager) and are no guarantee of the future performance of any American Century Investments' portfolio. This material has been prepared for educational purposes only. It is not intended to provide, and should not be relied upon for, investment, accounting, legal or tax advice.
IRS Circular 230 Disclosure: American Century Companies, Inc. and its affiliates do not provide tax advice. Accordingly, any discussion of U.S. tax matters contained herein (including any attachments) is not intended or written to be used, and cannot be used, in connection with the promotion, marketing or recommendation by anyone unaffiliated with American Century Companies, Inc. of any of the matters addressed herein or for the purpose of avoiding U.S. tax-related penalties.
This information is for educational purposes only and is not intended as tax advice. Please consult your tax advisor for more detailed information or for advice regarding your individual situation.
©2024 Morningstar, Inc. All Rights Reserved. Certain information contained herein: (1) is proprietary to Morningstar and/or its content providers; (2) may not be copied or distributed; and (3) is not warranted to be accurate, complete or timely. Neither Morningstar nor its content providers are responsible for any damages or losses arising from any use of this information.