Stay Ahead of Inflation
It may be time to take action. But how do you know you're making the right choices? Understanding how the stress of inflation affects you—and your investments—helps give you the power to make better decisions.

Assess the Risk
Inflation Means Your Money Will Buy Less in the Future

Counting on that $100,000 savings account? The loss of purchasing power from inflation can mean you need to withdraw more money than planned to cover the higher cost of living.
Here's how inflation guarantees your money will buy less in the future.
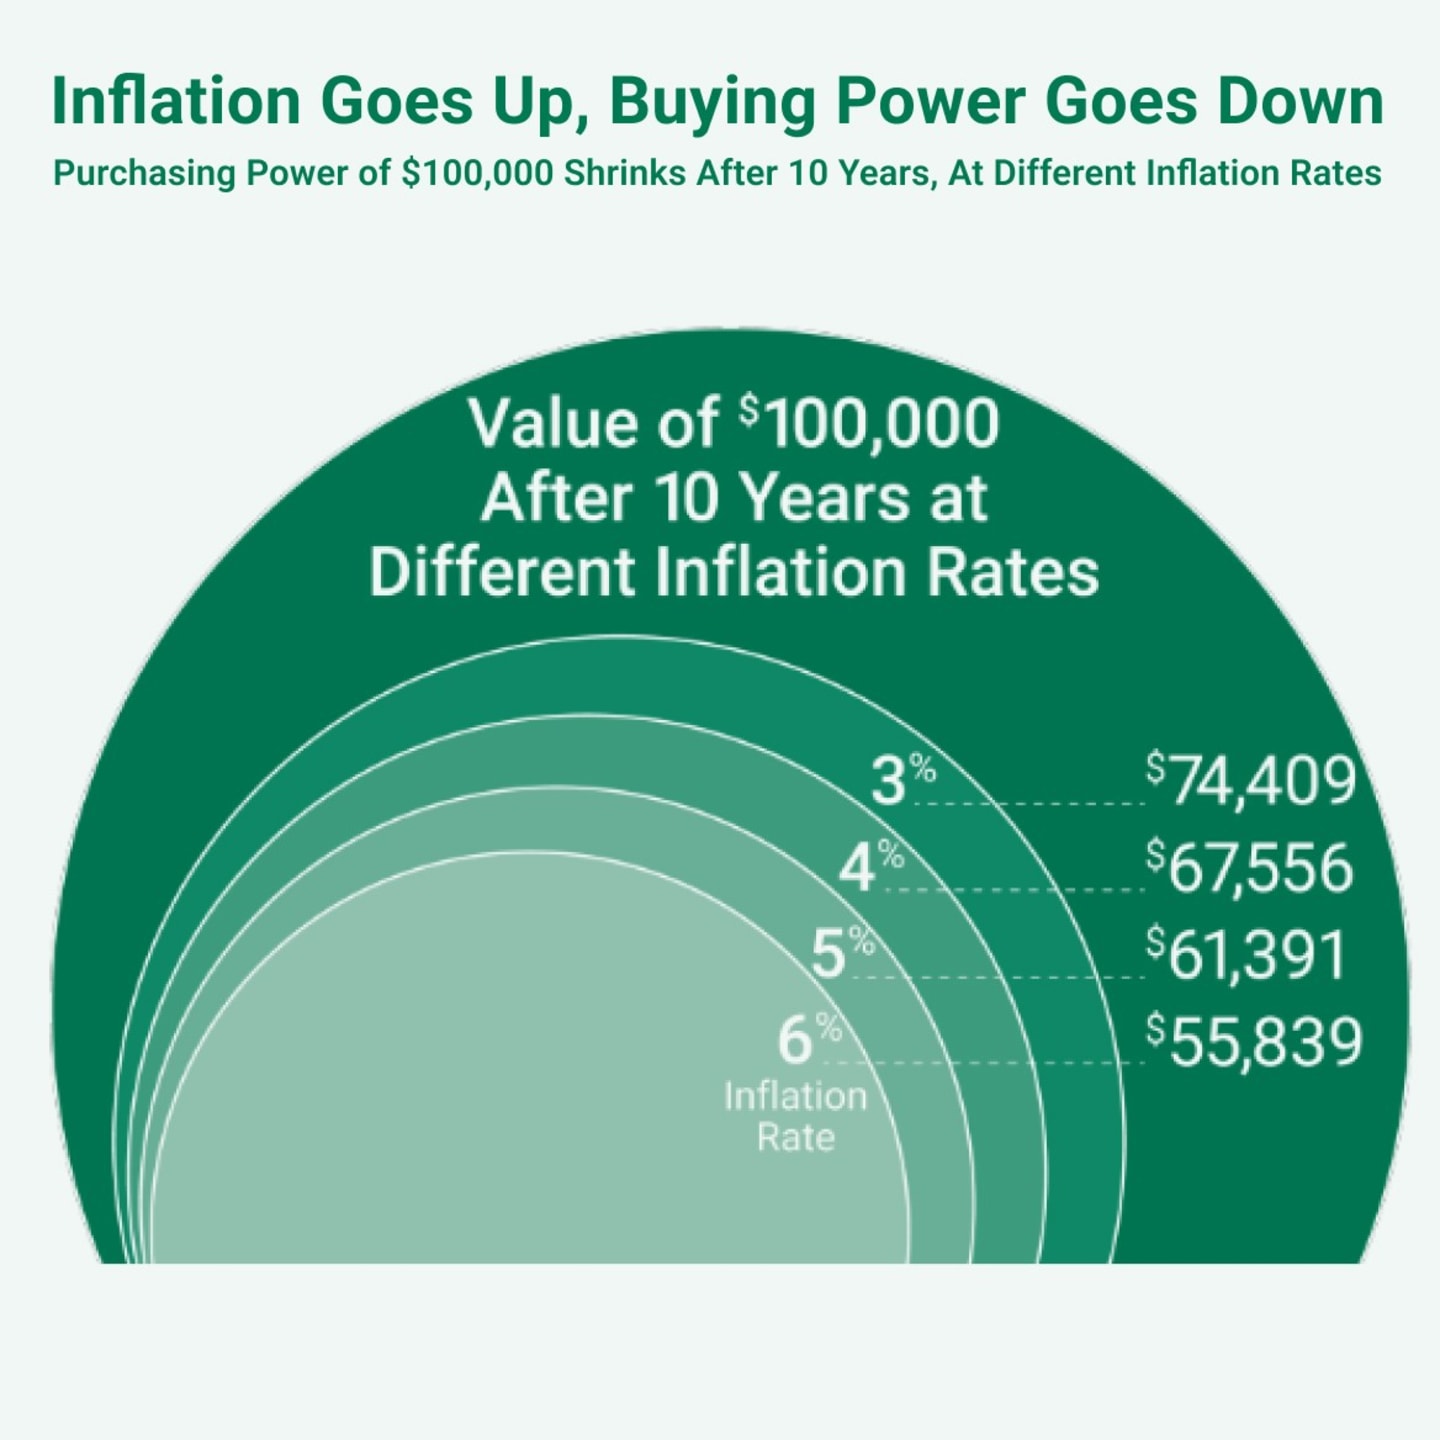

Inflation Shrinks Your Nest Egg—and Your Confidence
Even low inflation gradually eats away at your money. As our inflation calculator shows, at just 3%, a $100,000 investment will lose almost a quarter of its purchasing power over 10 years. At 6%, it could be cut in half.
See how inflation could affect your current portfolio.

How Does Inflation Affect the Markets—and Our Emotions?
Financial markets hate uncertainty. And inflation's rapid rise is an unknown dynamic. Specifically, people worry about the Federal Reserve's ability to control inflation without slowing economic growth too much.
It's also hard to decide which investments give you the best opportunity to keep your money growing ahead of inflation.
When uncertainty is high, the markets see large price swings. And these swings—better known as volatility—play into our emotions and decision-making.
Make Better Decisions
How Inflation Affects Investing

Are you your own worst enemy? Our perceptions and biases can lurk under the surface—preventing us from taking the right actions.
But there are steps you can take to make better decisions for your financial situation.

Overcoming Behavioral Biases in Investing
Certain behaviors can pop up during challenging times. Here's what to look for.
Recognizing Common Investor Biases
Do you see yourself in any of these examples? Get tips to overcome these behaviors.
Present Bias
Today's news and needs can pull your focus away from your long-term goals.
Action Bias
When under stress, you want to do something—even if no action is best.
Overconfidence
Be confident, but beware of blind spots. Consider other perspectives.
Availability Bias
Recent experiences color your outlook for the future—for better or worse.
Loss Aversion
You focus more on what you could lose instead of what you might gain.
Behavioral content Cass Sunstein ©2023 All Rights Reserved
Take Action
Look to Inflation-Hedging Investments

It’s a tricky balance. If you invest too aggressively on a short-time horizon, you risk losing money that you’ll need for the future. But if you invest too conservatively, your money may not grow enough. Finding the right balance is key to staying ahead of inflation.

What’s Your Goal?
Preservation
Goal: Preserve Purchasing Power
Keeping more of your hard-earned money and avoiding the impacts of inflation, volatility and other risks are your main goals, especially the closer you are to retirement.

Sample allocation.
See It in Action
To support these goals, consider reallocating 25% of your core bond portfolio to inflation-adjusted bonds, such as American Century Short Duration Inflation Protection Bond Fund.
The sample allocation illustrated in the graphic shows that, over the past five years, a 75/25 blended portfolio using Short Duration Inflation Protection Bond Fund:
Improved performance an average of 0.50% per year.
Reduced risk by 13%.
View Supporting Data

All data as of 3/31/2023.
Data reflects past performance, assumes reinvestment of dividends and capital gains and is no guarantee of future results. Current performance may be higher or lower than data shown. Investment return and principal value fluctuate. Redemption value may be more or less than original cost. View fund performance data as of the most recent month-end: American Century Short Duration Inflation Protected Bond Fund. Core Bonds representative data is presented quarterly.
For additional information, consult the prospectus.
Glossary Terms: Bloomberg U.S. Treasury Inflation Protected Securities (TIPS) Index, Standard Deviation
*The Core Bond investment category is represented by iShares Core US Aggregate Bond ETF (AGG), which is composed of a broadly diversified set of bond investments and includes SEC yield. AGG does not represent a specific investment in this comparison. Net Asset Value (NAV) prices are used to calculate market price performance prior to the date when the Fund first traded on the New York Stock Exchange or the NASDAQ Stock Exchange. Market performance is determined using the bid/ask midpoint at 4:00 p.m. Eastern time, when the NAV is typically calculated. Market performance does not represent the returns you would receive if you traded shares at other times. Following are daily closing prices as of the dates specified: 3/28/2013: $110.73; 3/29/2018: $107.25; 3/31/2020: $115.37; 3/31/2022: $107.10.
A**: Seeks to provide total return and inflation protection consistent with investment in inflation-indexed securities. With any investment, you could lose all or part of your investment in the Fund and the Fund’s performance could trail that of other investments. The Fund is subject to certain risks, including the principal risks noted below, any of which may adversely affect the Fund’s net asset value per share (“NAV”), trading price, yield, total return and ability to meet its investment objective. The order of the below risk factors does not indicate the significance of any particular risk factor.
Fixed income risks include interest-rate and credit risk. Typically, when interest rates rise, there is a corresponding decline in bond values. Credit risk refers to the possibility that the bond issuer will not be able to make principal and interest payments. Performance shown reflects fee waivers and or expense reimbursements of 0.01% by the investment advisor to the fund for all or some of the periods shown. Performance would have been lower without such waivers. Diversification and asset allocation may not protect against market risk or loss of principal. Transactions in shares of ETFs will result in brokerage commissions and will generate tax consequences. All regulated investment companies are obliged to distribute portfolio gains to shareholders.
The iShares Funds are distributed by BlackRock Investments, LLC. For more information about the fund, including a full discussion of risks, please see the fund’s prospectus on the iShares website at www.ishares.com/ishares/agg.
B***: Tracks the investment results of an index composed of the total U.S. investment-grade bond market.
All funds and ETFs: Provide daily liquidity. Principal is not guaranteed.
Additional Investments to Consider
To see fund ratings for all time periods, visit each fund's profile through the individual links below.
Name | Ticker | Overall Rating | # of Funds in Category |
TWUSX | ★★★★ Among 78 funds in the Short Government category | |
ACSNX | ★★★ Among 535 funds in the Short-Term Bond category |
As of 3/31/2023. For each fund with at least a three-year history, Morningstar calculates a Morningstar Rating™ based on a Morningstar Risk-Adjusted Return measure that accounts for variation in a fund's monthly performance, placing more emphasis on downward variations and rewarding consistent performance.
More About Morningstar
The Morningstar Rating™ for funds, or "star rating", is calculated for managed products (including mutual funds, variable annuity and variable life subaccounts, exchange-traded funds, closed-end funds, and separate accounts) with at least a three-year history. Exchange-traded funds and open-ended mutual funds are considered a single population for comparative purposes. It is calculated based on a Morningstar Risk-Adjusted Return measure that accounts for variation in a managed product's monthly excess performance, placing more emphasis on downward variations and rewarding consistent performance. The Morningstar Rating does not include any adjustment for sales loads. The top 10% of products in each product category receive 5 stars, the next 22.5% receive 4 stars, the next 35% receive 3 stars, the next 22.5% receive 2 stars, and the bottom 10% receive 1 star. The Overall Morningstar Rating for a managed product is derived from a weighted average of the performance figures associated with its three-, five-, and 10-year (if applicable) Morningstar Rating metrics. The weights are: 100% three-year rating for 36-59 months of total returns, 60% five-year rating/40% three-year rating for 60-119 months of total returns, and 50% 10-year rating/30% five-year rating/20% three-year rating for 120 or more months of total returns. While the 10-year overall star rating formula seems to give the most weight to the 10- year period, the most recent three-year period actually has the greatest impact because it is included in all three rating periods.
Income
Goal: Income Generation
Income is your top priority. You're ready to accept some risk to outpace inflation while still meeting your need for a steady stream of income.

Sample allocation.
See It in Action
Shorter duration fixed-income investments have less sensitivity to rising interest rates, which are common during periods of heightened inflation. For example, you could consider allocating 25% of your core bond portfolio to short-duration fixed income funds, such as American Century Short-Duration Strategic Income Fund.
The sample allocation illustrated in the graphic shows that a 75/25 blended portfolio:
Increased income by 11%.
Reduced interest-rate sensitivity by 17%.
View Supporting Data

All data as of 3/31/2023.
Data reflects past performance, assumes reinvestment of dividends and capital gains and is no guarantee of future results. Current performance may be higher or lower than data shown. Investment return and principal value fluctuate. Redemption value may be more or less than original cost. View fund performance data as of the most recent month-end: American Century Short Duration Strategic Income Fund. Core Bonds representative data is presented quarterly.
For additional information, consult the prospectus.
Glossary Terms: Bloomberg U.S. 1-3 Year Government/Credit Bond Index, Average Effective Duration, 12 Month Yield, 30 Day SEC Yield
*The Core Bond investment category is represented by iShares Core US Aggregate Bond ETF (AGG), which is composed of a broadly diversified set of bond investments and includes SEC yield. AGG does not represent a specific investment in this comparison. Net Asset Value (NAV) prices are used to calculate market price performance prior to the date when the Fund first traded on the New York Stock Exchange or the NASDAQ Stock Exchange. Market performance is determined using the bid/ask midpoint at 4:00 p.m. Eastern time, when the NAV is typically calculated. Market performance does not represent the returns you would receive if you traded shares at other times. Following are daily closing prices as of the dates specified: 3/28/2013: $110.73; 3/29/2018: $107.25; 3/31/2020: $115.37; 3/31/2022: $107.10.
A**: Seeks to provide total return and inflation protection consistent with investment in inflation-indexed securities. With any investment, you could lose all or part of your investment in the Fund and the Fund’s performance could trail that of other investments. The Fund is subject to certain risks, including the principal risks noted below, any of which may adversely affect the Fund’s net asset value per share (“NAV”), trading price, yield, total return and ability to meet its investment objective. The order of the below risk factors does not indicate the significance of any particular risk factor.
Fixed income risks include interest-rate and credit risk. Typically, when interest rates rise, there is a corresponding decline in bond values. Credit risk refers to the possibility that the bond issuer will not be able to make principal and interest payments. Performance shown reflects fee waivers and or expense reimbursements of 0.01% by the investment advisor to the fund for all or some of the periods shown. Performance would have been lower without such waivers. Diversification and asset allocation may not protect against market risk or loss of principal. Transactions in shares of ETFs will result in brokerage commissions and will generate tax consequences. All regulated investment companies are obliged to distribute portfolio gains to shareholders.
The iShares Funds are distributed by BlackRock Investments, LLC. For more information about the fund, including a full discussion of risks, please see the fund’s prospectus on the iShares website at www.ishares.com/ishares/agg.
B***: Tracks the investment results of an index composed of the total U.S. investment-grade bond market.
All funds and ETFs: Provide daily liquidity. Principal is not guaranteed.
Additional Investments to Consider
To see fund ratings for all time periods, visit each fund's profile through the individual links below.
Name | Ticker | Overall Rating | # of Funds in Category |
KORP | ★★★★ Among 190 funds in the Corporate Bond category | |
ASIEX | ★★★★ Among 287 funds in the Multisector Bond category | |
BCHYX | ★★★★★ Among 103 funds in the Muni California Long category | |
BCITX | ★★★★ Among 61 funds in the Muni California Intermediate category | |
ABHYX | ★★★★ Among 197 funds in the High Yield Muni category | |
TWTIX | ★★★★ Among 273 funds in the Muni National Interm category |
Effective February 14, 2023, Strategic Income Fund was renamed Multisector Income Fund.
As of 3/31/2023. For each fund with at least a three-year history, Morningstar calculates a Morningstar Rating™ based on a Morningstar Risk-Adjusted Return measure that accounts for variation in a fund's monthly performance, placing more emphasis on downward variations and rewarding consistent performance.
More About Morningstar
The Morningstar Rating™ for funds, or "star rating", is calculated for managed products (including mutual funds, variable annuity and variable life subaccounts, exchange-traded funds, closed-end funds, and separate accounts) with at least a three-year history. Exchange-traded funds and open-ended mutual funds are considered a single population for comparative purposes. It is calculated based on a Morningstar Risk-Adjusted Return measure that accounts for variation in a managed product's monthly excess performance, placing more emphasis on downward variations and rewarding consistent performance. The Morningstar Rating does not include any adjustment for sales loads. The top 10% of products in each product category receive 5 stars, the next 22.5% receive 4 stars, the next 35% receive 3 stars, the next 22.5% receive 2 stars, and the bottom 10% receive 1 star. The Overall Morningstar Rating for a managed product is derived from a weighted average of the performance figures associated with its three-, five-, and 10-year (if applicable) Morningstar Rating metrics. The weights are: 100% three-year rating for 36-59 months of total returns, 60% five-year rating/40% three-year rating for 60-119 months of total returns, and 50% 10-year rating/30% five-year rating/20% three-year rating for 120 or more months of total returns. While the 10-year overall star rating formula seems to give the most weight to the 10- year period, the most recent three-year period actually has the greatest impact because it is included in all three rating periods.
Growth
Goal: Investment Growth
You don't mind taking risks—so long as they’re the right kind. In addition to beating inflation, you're focusing on long-term growth.

Sample allocation.
See It in Action
You could consider a 20% allocation to a quality-oriented, large-cap stock fund that has the potential for faster-than-average earnings growth.
The sample allocation illustrated in the graphic shows that, over a 10-year period, an 80/20 mix of a global equity blended portfolio and a fund focused on accelerated earnings growth, such as American Century Ultra® Fund:
Increased return by over 12% with a modest rise in risk.
Delivered more than 89% outperformance against inflation (measured by Consumer Price Index (CPI)).
View Supporting Data

Performance and statistics are as of 3/31/2023.
Data reflects past performance, assumes reinvestment of dividends and capital gains and is no guarantee of future results. Current performance may be higher or lower than data shown. Investment return and principal value fluctuate. Redemption value may be more or less than original cost. View fund performance data as of the most recent month-end: American Century Ultra® Fund. Global Equity Blended Portfolio representative data is presented quarterly.
*Returns are based on 10-year annualized returns and risk (measured by standard deviation).
For additional information, consult the prospectus.
Glossary: Bloomberg US Aggregate Bond Index, Consumer Price Index (CPI), MSCI World Index, Russell 1000 Growth Index, Standard Deviation
**Global Equity Blended Portfolio is comprised of 90% MSCI World Index, 10% Bloomberg US Aggregate Bond Index
Source: MSCI. Morgan Stanley Capital International (MSCI) makes no express or implied warranties or representations and shall have no liability whatsoever with respect to any MSCI data contained herein. The MSCI data may not be further redistributed or used to create indices or financial products. This report is not approved or produced by MSCI. Source: Bloomberg Index Services Ltd
Additional Investments to Consider
To see fund ratings for all time periods, visit each fund's profile through the individual links below.
Name | Ticker | Overall Rating | # of Funds in Category |
AVUV | ★★★★ Among 451 funds in the Small Cap Value category | |
AVDE | ★★★★ Among 692 funds in the Foreign Large Blend category | |
AVEM | ★★★★ Among 744 funds in the Diversified Emerging Markets category | |
ANOIX | ★★★★ Among 576 funds in the Small Growth category | |
ACMVX | ★★★★ Among 385 funds in the Mid-Cap Value category |
As of 3/31/2023. For each fund with at least a three-year history, Morningstar calculates a Morningstar Rating™ based on a Morningstar Risk-Adjusted Return measure that accounts for variation in a fund's monthly performance, placing more emphasis on downward variations and rewarding consistent performance.
More About Morningstar
The Morningstar Rating™ for funds, or "star rating", is calculated for managed products (including mutual funds, variable annuity and variable life subaccounts, exchange-traded funds, closed-end funds, and separate accounts) with at least a three-year history. Exchange-traded funds and open-ended mutual funds are considered a single population for comparative purposes. It is calculated based on a Morningstar Risk-Adjusted Return measure that accounts for variation in a managed product's monthly excess performance, placing more emphasis on downward variations and rewarding consistent performance. The Morningstar Rating does not include any adjustment for sales loads. The top 10% of products in each product category receive 5 stars, the next 22.5% receive 4 stars, the next 35% receive 3 stars, the next 22.5% receive 2 stars, and the bottom 10% receive 1 star. The Overall Morningstar Rating for a managed product is derived from a weighted average of the performance figures associated with its three-, five-, and 10-year (if applicable) Morningstar Rating metrics. The weights are: 100% three-year rating for 36-59 months of total returns, 60% five-year rating/40% three-year rating for 60-119 months of total returns, and 50% 10-year rating/30% five-year rating/20% three-year rating for 120 or more months of total returns. While the 10-year overall star rating formula seems to give the most weight to the 10- year period, the most recent three-year period actually has the greatest impact because it is included in all three rating periods.
General Disclosures
There is no guarantee that the investment objectives will be met.
Diversification does not assure a profit nor does it protect against loss of principal.
The information is not intended as a personalized recommendation or fiduciary advice and should not be relied upon for, investment, accounting, legal or tax advice.
Exchange Traded Funds (ETFs) are bought and sold through exchange trading at market price (not NAV), and are not individually redeemed from the fund. Shares may trade at a premium or discount to their NAV in the secondary market. Brokerage commissions will reduce returns.
Fixed Income Disclosures
The value and/or returns of a portfolio will fluctuate with market and economic conditions.
Investments in fixed income securities are subject to the risks associated with debt securities including credit, price and interest rate risk.
Generally, as interest rates rise, the value of the securities held in the fund will decline. The opposite is true when interest rates decline.
The lower rated securities in which the fund invests are subject to greater credit risk, default risk and liquidity risk.
Credit risk is the risk that an obligation won't be paid and a loss will result. Generally, a lower credit rating indicates a greater risk of non-payment. Liquidity risk is the risk that the fund will have difficulty selling its debt securities.
Short Duration Inflation Protection Bond Fund
In certain interest rate environments, such as when real interest rates are rising faster than nominal interest rates, inflation-protected securities with similar durations may experience greater losses than other fixed income securities. Interest payments on inflation-protected debt securities will fluctuate as the principal and/or interest is adjusted for inflation and can be unpredictable.
iShares Core US Aggregate Bond ETF (AGG)
ETFs are baskets of securities that trade like stocks on an exchange and can be bought or sold throughout the trading day at fluctuating market prices (not NAV). Shares may trade at a premium or discount to NAV in the secondary market. Brokerage commissions will reduce returns. Like mutual funds, ETFs also have expense ratios. In general, actively managed ETFs cost more than passively managed index ETFs. Unlike mutual funds, it is possible to buy ETFs on margin and sell them short. ETFs held in a taxable account may result in less tax liabilities than similarly invested mutual fund the same account. Different companies offer ETFs. iShares are distributed by BlackRock Investments, LLC (together with its affiliates, BlackRock). All rights reserved. iShares and BLACKROCK are registered trademarks of BlackRock.
Ultra Fund
The fund is subject to potentially greater short-term price volatility than that associated with an average stock fund.
Avantis U.S. Small Cap Value ETF
Morningstar Rating - Investor Class
Morningstar Category - US Fund Small Value | Overall | 3 Year | 5 Year | 10 Year |
---|---|---|---|---|
Ratings | - | - | ||
# of Funds | 453 | 453 | - | - |
ALL DATA AS OF 3/31/2023. SOURCE: MORNINGSTAR.
The Morningstar Rating™ for funds, or "star rating", is calculated for managed products (including mutual funds, variable annuity and variable life subaccounts, exchange-traded funds, closed-end funds, and separate accounts) with at least a three-year history. Exchange-traded funds and open-ended mutual funds are considered a single population for comparative purposes. It is calculated based on a Morningstar Risk-Adjusted Return measure that accounts for variation in a managed product's monthly excess performance, placing more emphasis on downward variations and rewarding consistent performance. The Morningstar Rating does not include any adjustment for sales loads. The top 10% of products in each product category receive 5 stars, the next 22.5% receive 4 stars, the next 35% receive 3 stars, the next 22.5% receive 2 stars, and the bottom 10% receive 1 star. The Overall Morningstar Rating for a managed product is derived from a weighted average of the performance figures associated with its three-, five-, and 10-year (if applicable) Morningstar Rating metrics. The weights are: 100% three-year rating for 36-59 months of total returns, 60% five-year rating/40% three-year rating for 60-119 months of total returns, and 50% 10-year rating/30% five-year rating/20% three-year rating for 120 or more months of total returns. While the 10-year overall star rating formula seems to give the most weight to the 10- year period, the most recent three-year period actually has the greatest impact because it is included in all three rating periods.
Exchange Traded Funds (ETFs): Foreside Fund Services, LLC - Distributor, not affiliated with American Century Investment Services, Inc.
Mutual Funds: American Century Investment Services, Inc., Distributor.