What Does an Inverted Yield Curve Mean?

What Does an Inverted Yield Curve Mean?
While yield curves may not elicit the same excitement as watching a close sports game, many in the financial industry are paying attention to a potential looming “upset”—the prospect of short-term yields reaching higher levels than long-term yields—otherwise known as a yield curve inversion. A yield curve is a collection of interest rates for debts of various maturities.
A Treasury yield curve inversion can occur at more than one maturity, but often cited are 10-year Treasuries versus one- or two-year Treasuries. At the end of 2021, the spread, or difference between the 10-year Treasury yield and the two-year Treasury yield, was 0.75%. And, very briefly in early 2022, some parts of the curve experienced an inversion.
Inverted Yield Curves and Recessions
Why do investors pay such close attention to this measure? Normal yield curves generally slope upward, as the cost to borrow money or the interest rate to lend money tends to be higher for the longer the duration of the debt—i.e., lenders demand more for taking on additional uncertainty. When short-term rates approach or overtake long-term rates, which is viewed as inflationary, potential concerns include:
The Federal Reserve could quickly raise rates to combat inflation and, in so doing, cause a recession.
Investors could be willing to accept lower relative interest rates to hold longer-term government debt, believing long-term prospects for the economy are currently poor.
A Historical View of Yield Curve Inversions
Figure 1 shows the spread between the 10-year and one-year Treasury since October 1973. Inversions, or when the one-year Treasury was higher than the 10 year, are depicted in red. U.S. recessions are highlighted in gray. In Figure 1, we can see that many recent yield curve inversions preceded a recession.
Figure 1 | Many Yield Curve Inversions Preceded a Recession
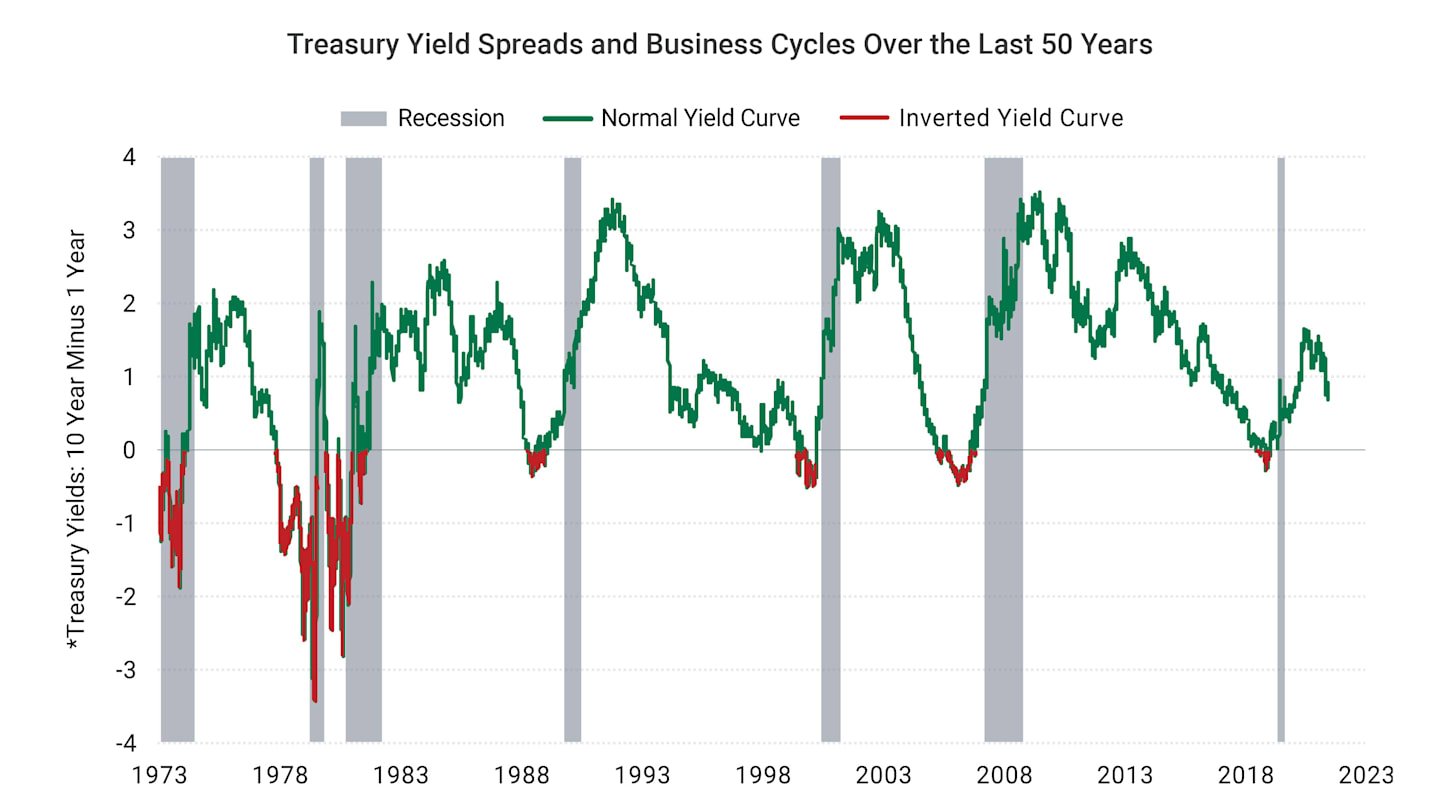
Data from 10/31/1973–3/24/2022. Source: St. Louis Federal Reserve (FRED), National Bureau of Economic Research (NBER), Avantis Investors.
It is understandable that some may see a possible yield curve inversion as an alarm bell starting to chime. But we would discourage investors from drawing too firm a conclusion from a yield curve inversion.
For one thing, while spreads like the 10-year Treasury minus three-month Treasury have recently been good “predictors” of a recession since the 1970s, if we extend our sample further back in time, we can note recessions (1957-1958, 1960-1961) where the curve did not invert, not to mention an inversion in 1966 where a recession did not occur soon after that.
As you may have often heard from economists, there is a stark difference between correlation and causation. In more plain language, just because events have happened close to one another in the past does not necessarily mean that one caused the other.
Yield Curve Inversions and the Stock Market
For those who may not be satisfied by the correlation-causation argument, we ran an experiment to see if there was any strong relationship between current yield spreads and subsequent stock returns. The following two figures display results for one shorter-term time frame and one longer-term time frame in different forms. There is no reason why we chose one form over the other for each period. We included the different formats as some readers may find one easier to interpret than the other.
Figure 2 is a scatter plot comparing daily yield spreads between 10-year and one-year Treasuries versus the U.S. stock market return over the next six months. Each dot represents a day.
Yield curve inversions are on the left side of the chart when the number along the horizontal (x axis) is negative.
What do we observe? First, there are lots of positive return observations and negative return observations when the yield curve is inverted. The subsequent six-month returns range from greater than 40% to almost -40%. Second, the data appear more cloudlike, suggesting no strong relation between current yield spreads and subsequent stock market performance.
Figure 2 | Current Yield Spreads and Stock Market Performance
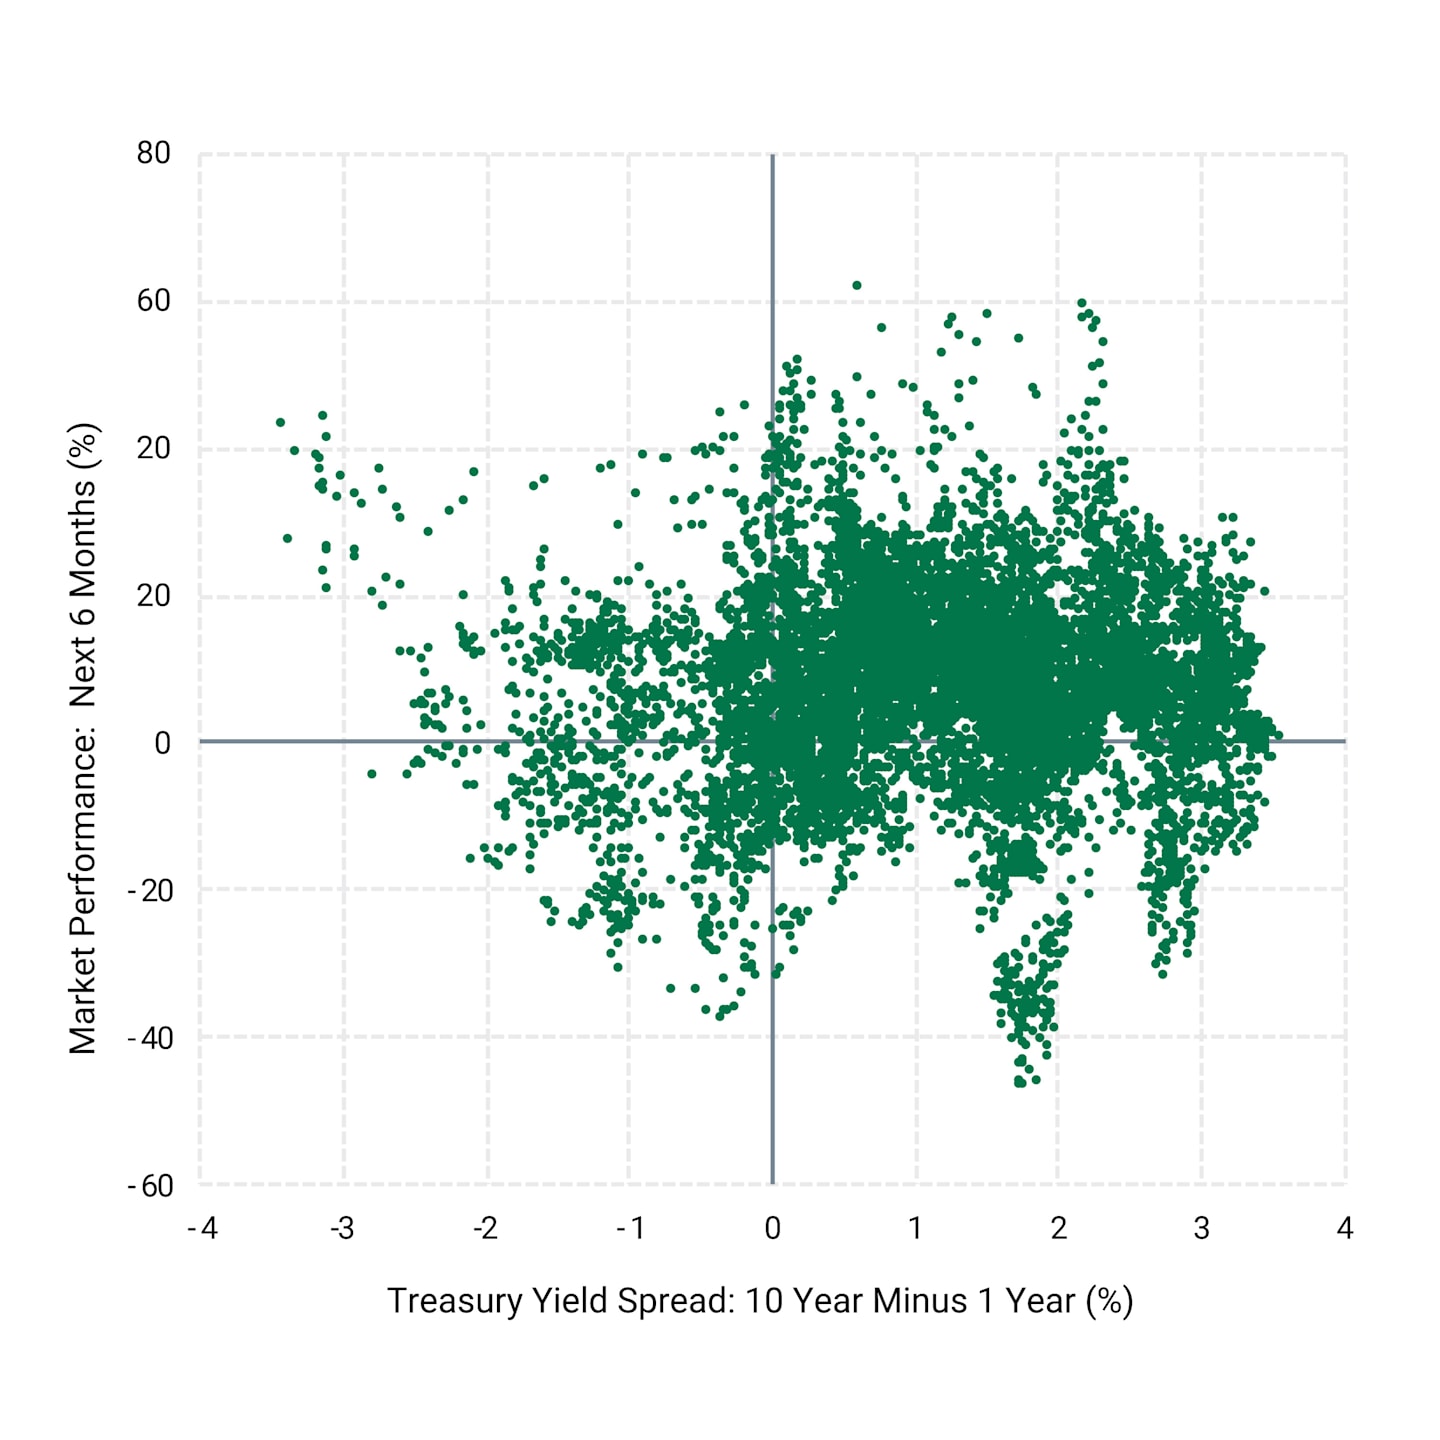
Data from 10/31/1973–12/31/2021. Source: St. Louis Federal Reserve Bank (FRED), Avantis Investors. The CRSP U.S. Total Market Index represents U.S. stock market performance. Past performance is no guarantee of future results.
In Figure 3, we plot two lines. We have taken all the daily dots from Figure 2 and arranged them chronologically. The gray line shows the current yield spread over time, and the line is red when the yield curve is inverted (left-hand axis). The gray line shows the subsequent three-year U.S. stock market return (right-hand axis). Once again, we observe a lot of noise. There are many periods where subsequent three-year returns are positive, and several where returns are negative. We don’t see a strong relationship between these two variables over our sample period.
Figure 3 | Current Yield Spreads and Subsequent 3-Year Stock Market Returns
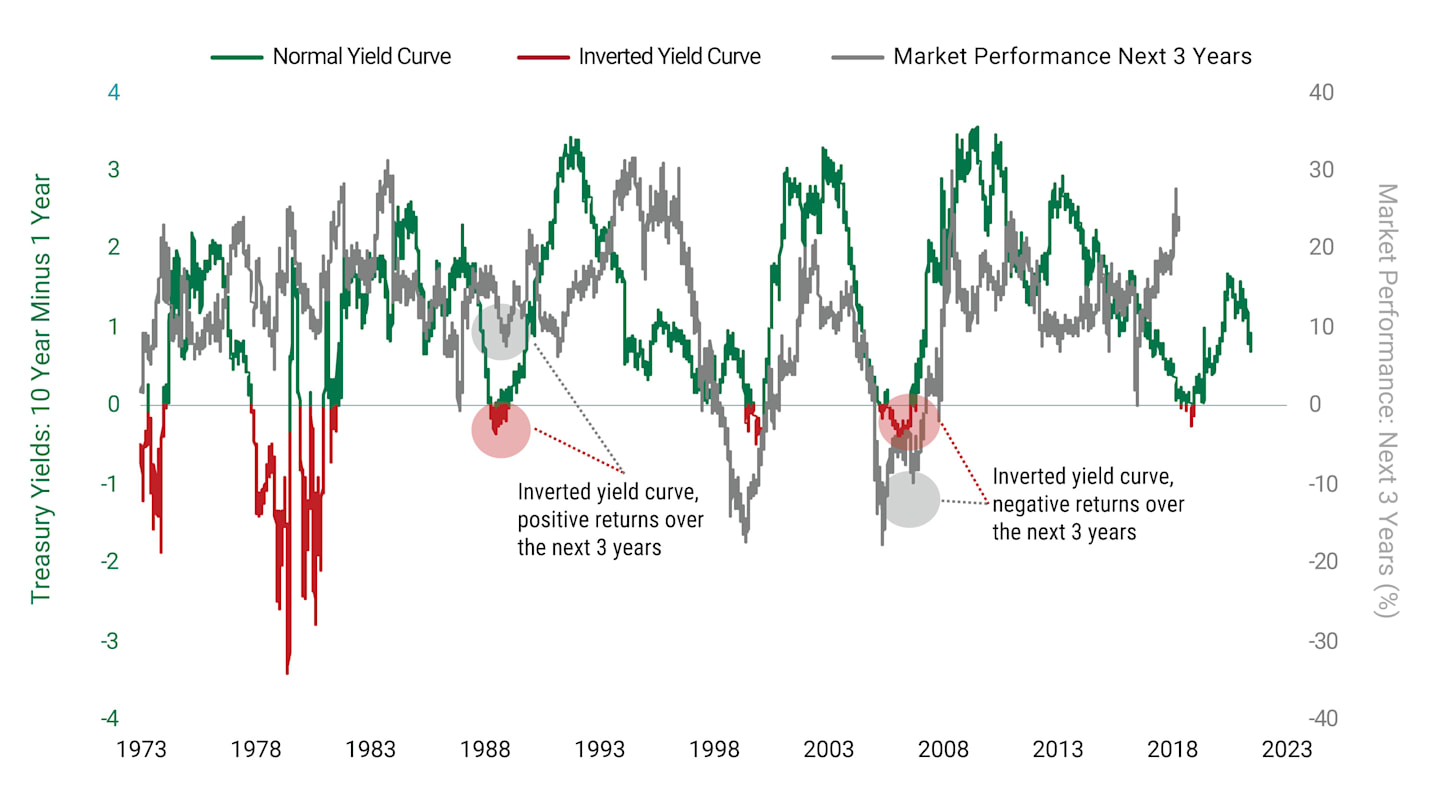
Data from 10/31/1973–12/31/2021. Source: St. Louis Federal Reserve Bank (FRED), Avantis Investors. Past performance is no guarantee of future results.
Be Wary of False Alarms
Does an inverted yield curve have economic implications? Perhaps. Should news of a possible yield curve inversion lead you to sell out of stocks? Probably not. Economists and practitioners use countless signals to make predictions about the future.
While there can be logical theories for how or why such signals provide us with certain information, as investors, we are likely better off remembering there is far more that is uncertain. Figure 4 shows that there have been market runs and drops in normal and inverted yield curves.
Figure 4 | The Stock Market Has Delivered Over the Long Haul Through Inverted Yield Curves and Recessions
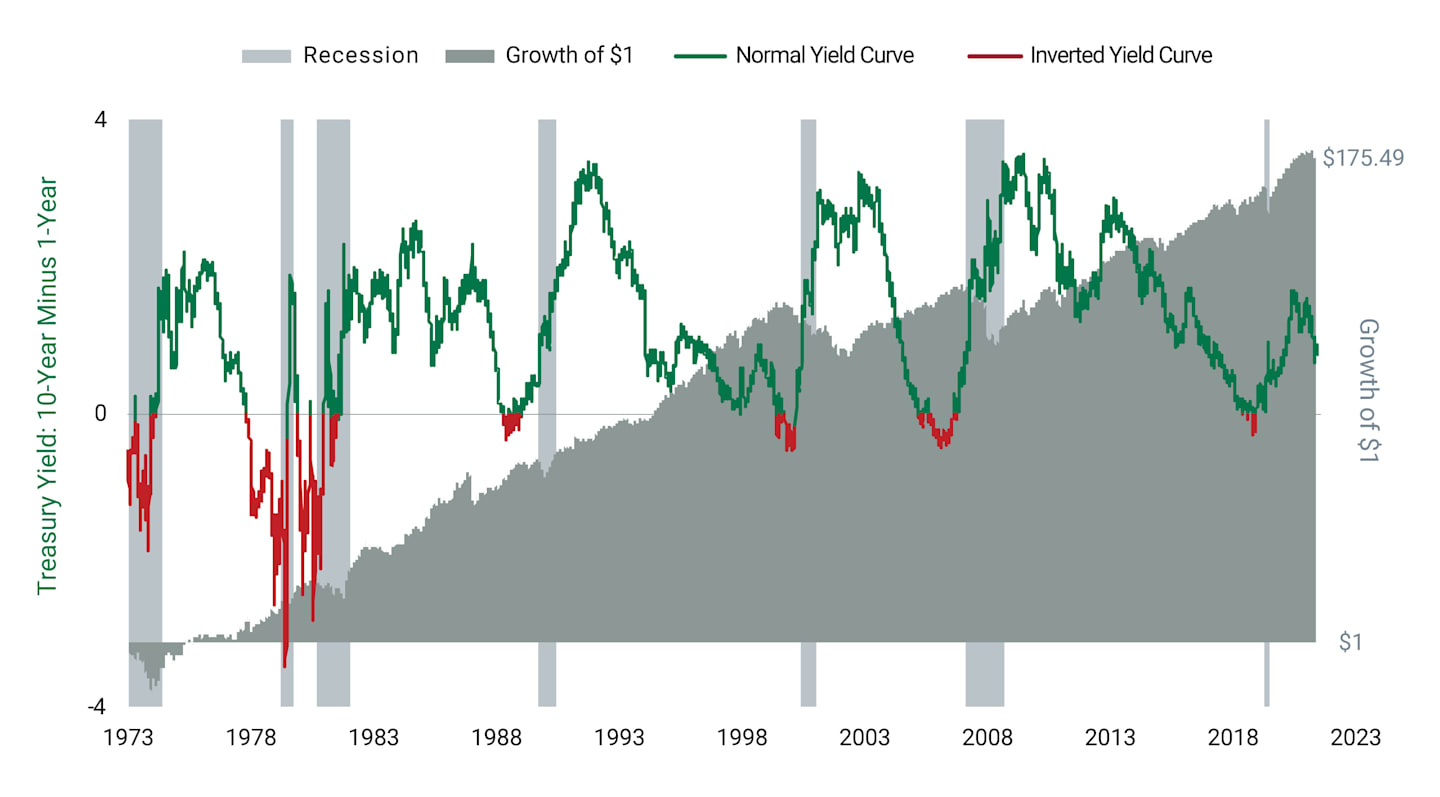
Data from 10/31/1973–12/31/2021. Source: St. Louis Federal Reserve Bank (FRED), Avantis Investors. Past performance is no guarantee of future results.
Uncertainty is something we must face, and while not always comfortable, we believe the ability to stay in your seat and remain invested provides the best chance for good results over the long term. Once again, this demonstrates how investors willing to stick with stocks over the long haul have historically been rewarded.
Explore More Insights
Read our latest articles and market perspectives.
CRSP U.S. Total Market Index. Consists of nearly 4,000 constituents across mega, large, small and micro capitalizations, representing nearly 100% of the U.S. investable equity market.
This material has been prepared for educational purposes only. It is not intended to provide, and should not be relied upon for, investment, accounting, legal or tax advice.
Investment return and principal value of security investments will fluctuate. The value at the time of redemption may be more or less than the original cost. Past performance is no guarantee of future results.
Diversification does not assure a profit nor does it protect against loss of principal.
Index performance does not represent the fund's performance. It is not possible to invest directly in an index.