Reading the Labor Market: What Jobs Data Means for Investors
An aging population and shifting immigration patterns are reshaping the workforce — and changing how investors interpret jobs data.

Key Takeaways
Along with technology and productivity gains, shifting demographics have helped redefine the characteristics of a stable U.S. labor market.
The Fed’s hawkish shift and reduced forward guidance suggest that persistent inflation may be taking priority over concerns about slower job growth.
With yields on the rise, short-maturity bonds may offer relative value while limiting exposure to interest rate volatility.
The U.S. economy has continued to grow despite mixed signals from the labor market. According to Bureau of Labor Statistics (BLS) data, job creation has slowed in 2026. But so has the unemployment rate.
Meanwhile, demographic shifts and changes in immigration patterns are reshaping the workforce — even as gross domestic product (GDP) projections point to further economic growth.
Here’s what the jobs and GDP dynamic may mean for Federal Reserve (Fed) policy, bond markets and investors’ long-term plans.
Why Are Fewer Jobs Available Despite Continued Economic Growth?
Job creation has fallen far short of the level economists typically view as necessary to keep the U.S. labor market stable. At the same time, the unemployment rate has remained relatively steady, and GDP forecasts have been positive. These conditions may reflect a shrinking workforce, shifting immigration trends and the effects of investment in artificial intelligence (AI).
Slower Job Growth May Not Signal a Weak Labor Market
The U.S. added an average of 34,000 jobs per month from July 2025 to July 2026.1 Although that pace is low by historical standards, the economy may now need fewer new jobs to keep the unemployment rate stable.
Economists refer to this threshold as the “break-even” level of monthly payroll growth. Economists previously pegged the break-even level at 150,000 to 200,000 jobs per month but now place the range at 15,000 to 87,000.2
A smaller workforce — partly due to an aging population and slower immigration — means modest job gains may be sufficient to keep unemployment from rising.
Fed Board Chair Kevin Warsh recently told Congress that job creation “has kept pace with the workforce.”3 Fed economists have similarly noted that occasional job losses — such as those reported in July 2026 — wouldn’t necessarily be unusual when the break-even level is low.4
Revisions have also made recent employment trends harder to interpret.5 In July 2026, the BLS lowered its estimates for May and June by a combined 103,000 jobs. It also revised total job growth down by 400,000 for 2025, leaving the economy with 181,000 jobs added for the year, or about 15,000 per month. That marked the weakest annual job growth outside a recession since 2003.
Weak hiring and sizable downward revisions can raise concerns about an economic slowdown or recession. However, investors should consider today’s data alongside changes in the size of the workforce and broader measures of economic activity. As of September 2026, the Fed projected 2.3% GDP growth for the year.6
Why Is the U.S. Workforce Shrinking
Two factors are limiting the number of people available to work: the long-term aging of the population and a recent slowdown in immigration. Together, they may help explain why the economy can remain stable despite fewer monthly job gains.
An Aging Population Is Slowing Workforce Growth
The U.S. population is aging as more Americans reach retirement age. In 2000, about 12% of the population was 65 or older.7 By the end of 2025, that share had risen to approximately 18%, as shown in Figure 1.
As this group grows, retirements may increasingly outpace the number of younger workers entering the labor force.8 The participation rate for older workers rose to 19.1% in 2025, up from 12.9% in 2000. Nevertheless, older adults remain less likely than younger Americans to work or seek employment.9
Figure 1 | The Share of the U.S. Population Age 65 and Older Is Rising
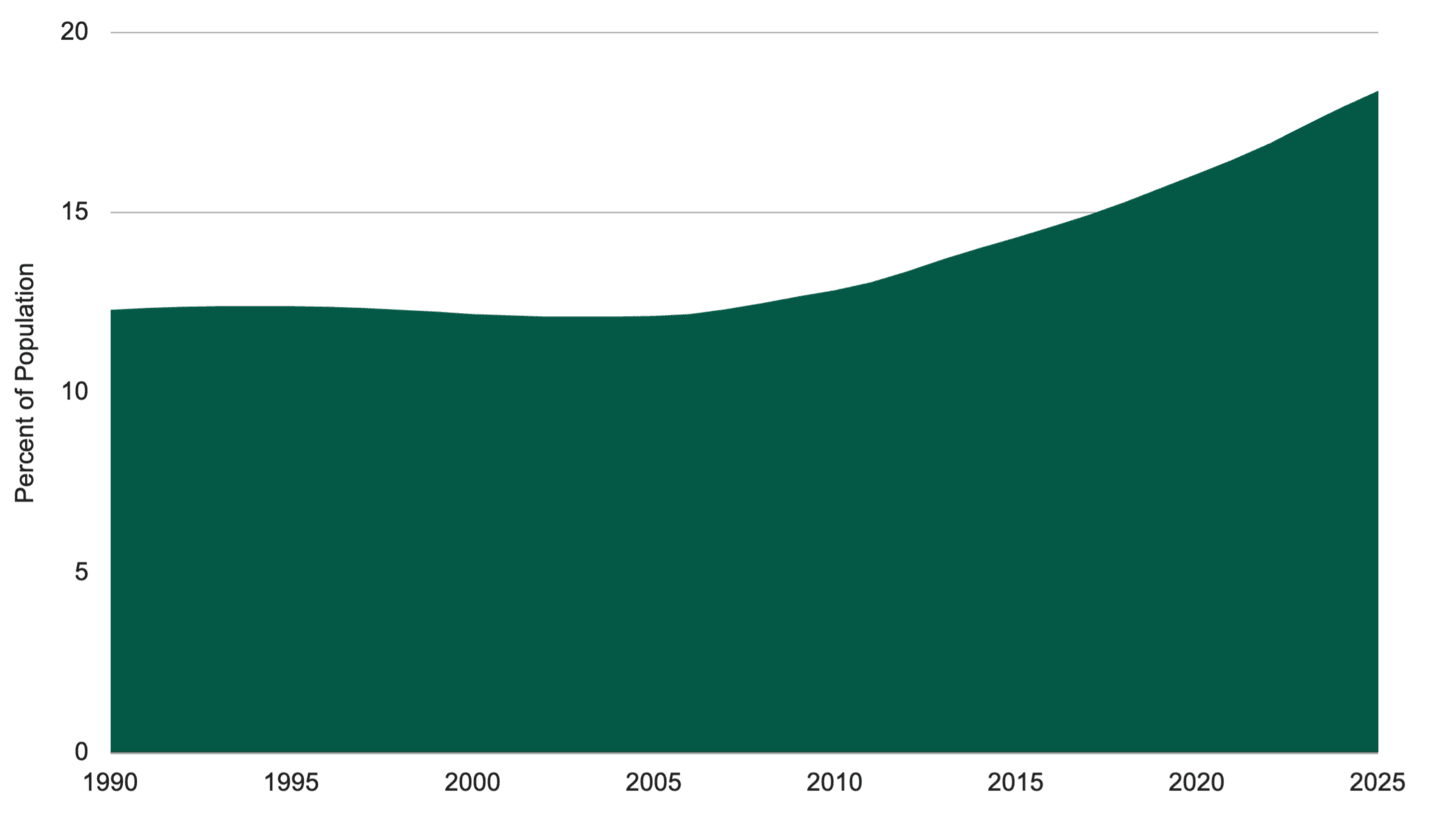
Data from 1/1/1990–12/31/2025. Source: Federal Reserve Bank of St. Louis.
The labor force participation rate has also declined, falling from 62.2% in July 2025 to 61.4% in July 2026. This marked the lowest July reading in 50 years, excluding the pandemic years of 2020 and 2021.10
An update to the population estimates BLS uses in its calculations accounted for much of the reported 2026 decline. Beyond this adjustment, an aging population and lower participation among workers ages 25 to 54 contributed to the decline in the labor force participation rate.11
Other Measures Point to Labor Market Stability
Weekly continuing jobless claims remain low, falling to 1.8 million in early August 2026, compared with a nearly 60-year average of 2.7 million. Meanwhile, through the first six months of 2026, the job quits rate largely held steady at 2%, the average rate for nearly 26 years. This suggests employees are reluctant to leave their jobs in what economists have dubbed a “low-hire, low-fire” economy.
Slower Immigration Is Limiting Workforce Growth
Net immigration to the U.S. peaked at approximately 3.3 million in 2023, according to the Congressional Budget Office (CBO). The CBO projects net immigration will fall to 570,000 in 2026.12 The San Francisco Fed estimates that this level is too low to support growth in the working-age population.13
In addition to dampening labor force growth, slower immigration may weigh on consumer spending and overall economic growth.14 On the other hand, a slower pace of immigration can lead to wage growth, as employers may have to compete more aggressively for employees.
What Does the Fed’s Policy Shift Mean for Investors?
The Fed’s dual mandate is to promote maximum employment and price stability. Before February 2026, markets expected a dovish Fed to cut rates several times to bolster the labor market. By June, however, expectations had shifted as rising energy prices tied to the Middle East conflict prompted a more hawkish response.
The shift suggests the Fed is prioritizing price stability amid persistent above-target inflation, as the labor market remains resilient. Inflation continues to challenge the Fed as it seeks to maintain a healthy job market while restoring price stability.
What Does Reduced Fed Guidance Mean for Markets?
Following the June 2026 Federal Open Market Committee (FOMC) meeting, Fed Board Chair Warsh revealed his preference for eliminating forward guidance. He has long argued that signaling the future path of interest rates suggests the Fed is highly confident in the economy’s future. Warsh believes that such displays of confidence are misleading and risky because economic conditions and inflation shocks are inherently uncertain.
He didn’t participate in the June or September quarterly dot plot, which has shown central bankers’ interest rate forecasts since 2012. Warsh has said that avoiding projections could encourage markets to focus more on economic data than on Fed communications, potentially reducing perceptions of policy certainty.
How Are Bond Markets Responding?
As Warsh seeks to reduce forward guidance, interest rate volatility may remain elevated. Yields on longer-maturity Treasuries have risen sharply. For example, on September 24, the 30-year Treasury yield reached 5.44%, and the 10-year reached 5.15%, both at their highest levels since 2004.15
Higher yields indicate that investors are seeking more compensation for longer-term lending and for the risk that inflation could erode returns.16 Rising yields can also increase borrowing costs for the federal government, potentially limiting its capacity for other spending.17
At the same time, higher yields can expand opportunities for investors in the bond market.
Bond prices and yields have an inverse relationship. That is, prices of existing bonds generally fall when interest rates rise. That’s because newly issued bonds feature higher yields, thereby offering more income than comparable bonds issued when rates were lower.
In our view, short-maturity bonds may offer attractive relative value in periods of rising rates and Fed tightening. These bonds may provide income and total return potential while limiting sensitivity to interest rate volatility versus longer-maturity bonds.
The bond market responds quickly to changes in economic conditions and can offer insight into investors’ expectations for growth, inflation and Fed policy. As these factors evolve, movements in bond yields may help investors assess the broader economic outlook.
Rethinking Jobs Data: What Comes Next?
Evolving jobs data and a changing labor market are reshaping how investors interpret the numbers.
A smaller workforce — largely due to an aging population and slower immigration — is redefining what a stable labor market looks like. As a result, the economy may need fewer new jobs than it did in the past to keep unemployment relatively steady. Recent job gains may reflect this lower baseline rather than broad economic weakness.
Labor force participation, unemployment claims and wage growth can provide additional context about the labor market’s direction. The Fed will likely monitor these measures as it balances maximum employment and price stability. Because labor market trends can shape expectations for Fed policy, interest rates and bond yields, no single data point tells the full story.
For long-term investors, considering a range of data over time rather than focusing on a single jobs report may provide the best labor market insights.
Authors
Client Portfolio Manager, Global Fixed Income
Fed Watch: Latest Insights on the Federal Reserve
Learn how Fed policy can influence financial market trends and affect your portfolio.
U.S. Bureau of Labor Statistics, “Employment Situation Summary,” August 7, 2026.
Yusuf Mercan, “Declining Immigration and an Aging Population Are Reducing Breakeven Employment Growth,” Federal Reserve Bank of Kansas City, October 15, 2025; Alexander Bick, “Breakeven Employment Growth: Estimate Range Widens in 2026,” Federal Reserve Bank of St. Louis, March 24, 2026.
Chairman Kevin Warsh, “Semiannual Monetary Policy Report to the Congress,” Testimony, Board of Governors of the Federal Reserve System, July 14, 2026.
Seth Murray and Ivan Vidangos, “Labor Force Growth, Breakeven Employment, and Potential GDP Growth,” Board of Governors of the Federal Reserve System, April 2, 2026.
U.S. Bureau of Labor Statistics, “Employment Situation News Release,” April 3, 2026.
Board of Governors of the Federal Reserve System, “Summary of Economic Predictions,” September 16, 2026.
Julie Meyer, “Census 2000 Brief: Age: 2000,” U.S. Census Bureau, October 2001.
U.S. Census Bureau, “Populations and People,” accessed September 15, 2026.
U.S. Bureau of Labor Statistics, “Nearly One in Five Older Americans in the Labor Force in 2025,” The Economics Daily, May 28, 2026.
U.S. Bureau of Labor Statistics, “Civilian Labor Force Participation Rate,” accessed August 20, 2026.
Alexander Blick, “What’s Behind the Sharp Drop in Labor Force Participation?” Federal Reserve Bank of St. Louis, August 4, 2026.
Congressional Budget Office, “The Demographic Outlook: 2026 to 2056,” January 2026.
Evgeniya Duzhak and Addie New-Schmidt, "Immigration and Changes in Labor Force Demographics," Economic Letter, Federal Reserve Bank of San Francisco, November 19, 2025.
Wendy Edelberg, Stan Veuger, and Tara Watson, “Macroeconomic Implications of Immigration Flows in 2025 and 2026: January 2026 Update,” Brookings Institution, January 13, 2026.
Wall Street Journal, September 24, 2026.
Trading Economics, “US 10-Year Treasury Note Yield,” Accessed August 18, 2026.
Spencer Feingold, “Bond Sell-Off: Why Government Bond Yields Soared and Why It Matters,” World Economic Forum, August 20, 2026.
Investment return and principal value of security investments will fluctuate. The value at the time of redemption may be more or less than the original cost. Past performance is no guarantee of future results.
The opinions expressed are those of American Century Investments (or the portfolio manager) and are no guarantee of the future performance of any American Century Investments portfolio. This material has been prepared for educational purposes only. It is not intended to provide, and should not be relied upon for, investment, accounting, legal or tax advice.
Generally, as interest rates rise, the value of the bonds held in the fund will decline. The opposite is true when interest rates decline.