How Layers of Inflation Affect Consumer Prices
Peeling the inflation onion reveals the factors influencing consumer pricing trends, Fed policy and investor portfolios.

Key Takeaways
Like an onion, inflation has several layers. Peeling back these layers illustrates how different goods and services broadly affect consumer prices.
For the Fed, setting monetary policy includes gauging a complex mix of backward-looking economic data and expectations for future prices.
While no investment is immune from inflation, certain choices, like Treasury inflation-protected securities, may help ease the impact of rising prices.
Recurring forces, such as geopolitics, trade policies, oil price volatility and global supply chain shifts, typically shape the inflation landscape. With so many layers, it’s not surprising that some people compare inflation to an onion.
Inflation has many analogies, but the onion model offers a durable way to understand inflation in any economic climate. That’s because the same three layers consistently respond to inflationary shocks in predictable ways.
Let's peel back these layers to understand what drives inflation and how it influences the Federal Reserve’s (Fed’s) policy decisions and investor portfolios.
What Are the Three Layers of Inflation?
John C. Williams, president and CEO of the Federal Reserve Bank of New York, has likened inflation to an onion with three layers, as shown in Figure 1.1
Figure 1 | Peeling the Inflation Onion
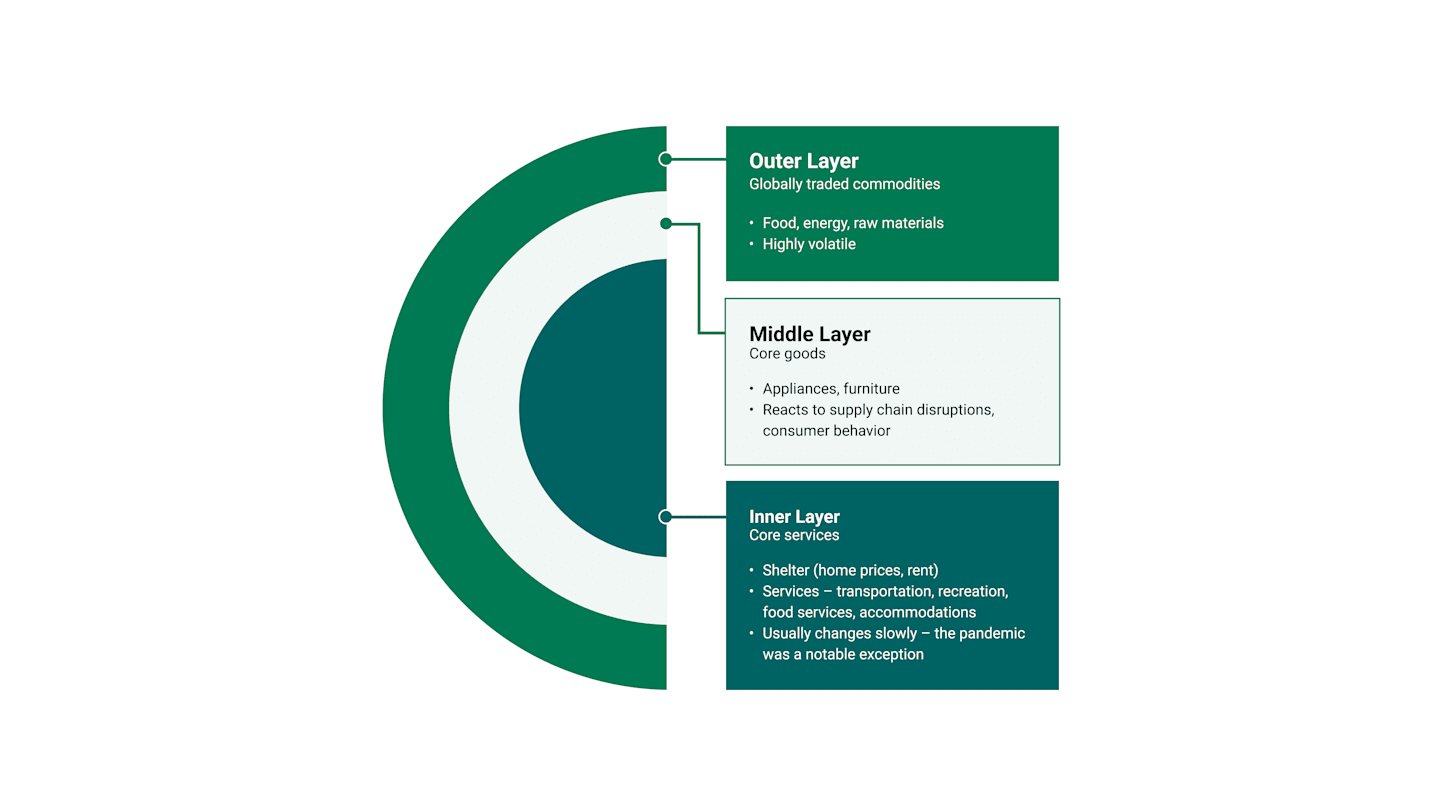
The Outer Layer
The outer layer of the inflation onion includes globally traded commodities like food, energy and raw materials, making it the most volatile layer. Geopolitical tensions, such as the Middle East conflict and trade disruptions, which limit the flow of commodities, can trigger rapid swings in this layer.
For example, the conflict in the Middle East has driven energy prices higher, prompting producers to pass on the increases to consumers. Additionally, the Trump administration raised tariffs on many imports from major trading partners. While typically not long-term drivers, tariff-related price hikes can increase near-term costs for businesses and consumers.
The Middle Layer
Core goods include appliances, furniture and cars (but not food and energy), representing the middle layer of the inflation onion. Core goods inflation typically responds to shifts in global supply chain strategies and trends like “nearshoring.” Short-term inflation expectations, tariff policies or national security-based import restrictions can raise costs in this layer.
Tariffs will likely have the most immediate impact on the outer and middle layers of the inflation onion. Any resulting increase in the core inflation rate could force the Fed to raise interest rates. However, if tariffs also trigger a notable slowdown in economic growth, the Fed may find itself in a conundrum.
Some economists believe fiscal stimulus, tax and regulation cuts, increased domestic energy production and onshoring could offset the effects of tariffs.
The Inner Layer
This layer consists of core services, which are the trickiest to control. They typically change gradually because they are tied to wage growth, demographics and structural housing dynamics. The inner layer includes shelter (rent, owners’ equivalent rent and lodging) and services like education and barber visits.2
Some economists isolate housing services from inflation equations because housing prices have diverged from those of other goods and services in recent years.3 For example, core goods and services prices generally moderated post-pandemic, while housing costs have remained stubbornly elevated, as shown in Figure 2. Housing price gains have moderated recently, but they still comprised more than half of the annual core CPI rate at year-end 2025.4
Figure 2 | Housing Has Made an Outsized Contribution to Core Inflation
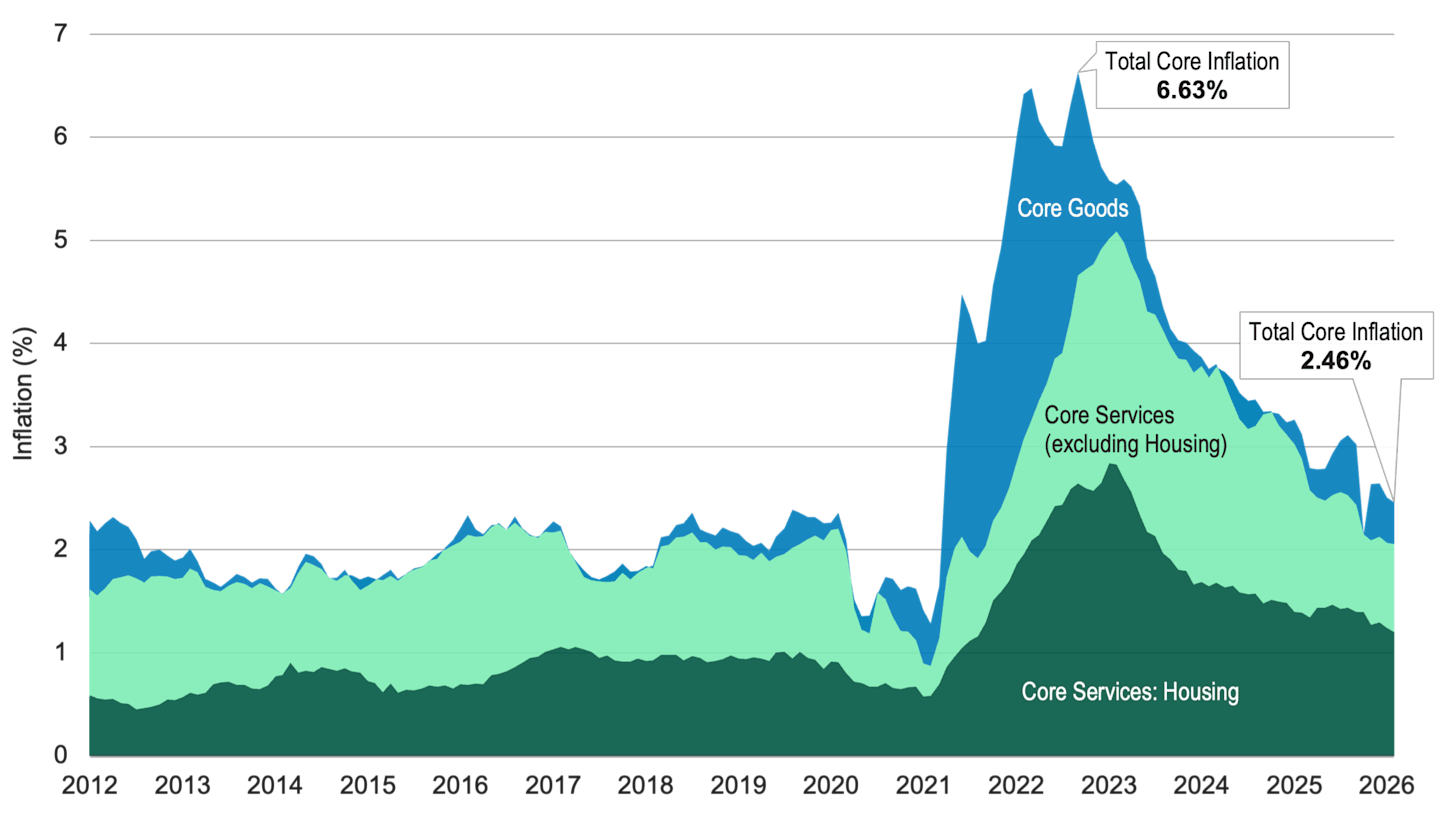
Data from 1/31/2012 – 2/27/2026. Source: FactSet. Core inflation is measured by the Consumer Price Index (CPI).
What Inflation Layers Signal to Policymakers
Because economic metrics are backward-looking, the Fed must implement policy based on its best inflation forecast. This is especially important during periods of uncertainty, such as trade realignments, election-driven policy shifts or international conflicts.
One thing to keep in mind is that policymakers are usually less concerned about one-off events (like tariffs) than persistent inflation trends. In general, prices comprising the core of the onion — which the Fed finds most useful — are less likely to change dramatically.
For example, Fed officials may be less concerned about a temporary jump in oil prices than material changes in transportation services costs. A notable rise in core services, largely due to their strong link to wage growth, may signal mounting inflationary pressures.5
What Drives Inflation?
A Complex Web of Supply and Demand Forces
Following the Global Financial Crisis, inflation lingered at historically low levels. This changed abruptly in 2021, when inflation began soaring to multidecade highs amid the effects of the pandemic.
Since peaking in mid-2022, inflation has eased significantly but remains above the Fed’s target. Several forces can pressure prices and drive the inflation rate higher, including:
Supply issues. Supply chain bottlenecks, shipping disruptions, raw material shortages and labor shortages can trigger “cost-push” inflation.
Demand surges. Prices rise when demand for goods or services outstrips supply or production capacity.
Government spending. When the government prints money to finance its spending, the nation’s money supply grows. And when more money goes into circulation, the dollar’s value declines, causing prices to rise.
Consumer expectations. When consumers expect higher inflation in the future, their behavior can make it a reality. For example, employees can demand higher wages, prompting businesses to raise prices.
What Peeling the Inflation Onion Means for Consumers
We all feel the pinch of higher prices at the grocery store and gas station, but higher prices have more profound consequences over time. Higher inflation ultimately erodes your purchasing power. If prices increase and your income doesn’t rise at the same pace, your dollars won’t go as far.
Inflation can also erode your investment returns. “Inflation risk” refers to the possibility that your investment performance won’t keep up with the pace of inflation. If you’re retired or nearing retirement, this is a critical consideration for meeting your income goals.
How Inflation Affects Different Asset Classes
No investment asset class is immune to inflation risk, but fixed-income securities may be more vulnerable. For example, when inflation rises, interest rates typically rise as well. But rising rates make existing bonds with lower rates less attractive, and their prices decline.
Similarly, inflation erodes the purchasing power of a bond’s fixed interest payment. Consider a bond that pays $500 in interest annually. A persistently high or steadily rising inflation rate will stifle the future buying power of the bond’s annual interest payment.
However, some fixed-income securities offer better inflation-fighting potential, underscoring the possible appeal of holding a diversified bond portfolio. For example, Treasury inflation-protected securities (TIPs) are designed to protect investors against inflation.
The face, or principal, value of TIPS adjusts along with the inflation rate. So, when inflation rises, TIPS’ values also rise (and when inflation drops, TIPS’ values decline). Moreover, when inflation rises, interest payments on TIPS also increase because they are based on the adjusted principal.
Why Diversification Matters When Inflation Erodes Purchasing Power
As Figure 3 illustrates, a diversified portfolio of stocks, bonds and real assets can help curtail the negative effects of inflation. Over time, many asset classes have historically delivered returns that outpaced inflation.
Figure 3 | Asset Classes vs. Inflation
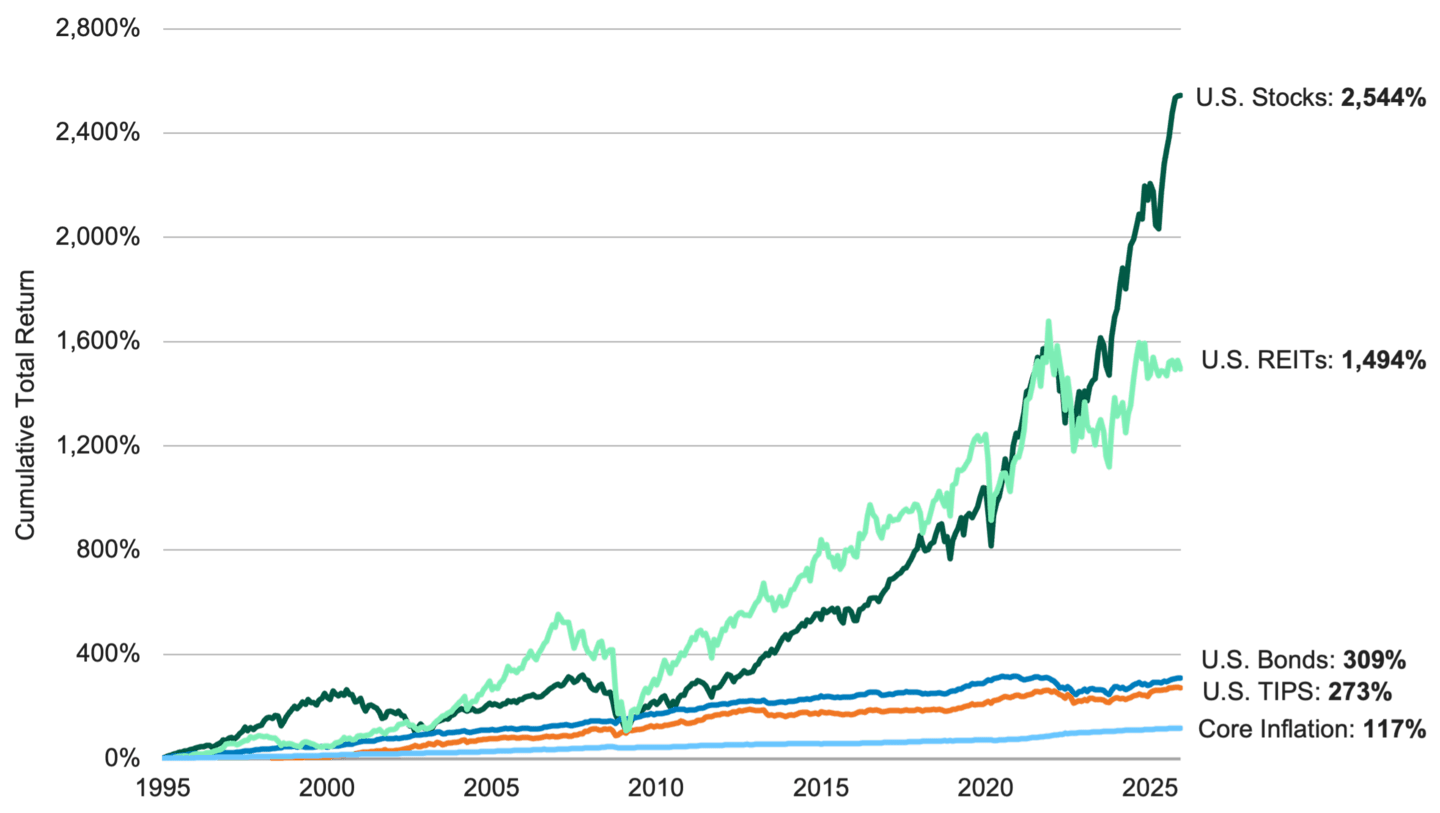
Data from 12/31/1994 – 12/31/2025. Source: FactSet. Past performance is no guarantee of future results. U.S. stocks are represented by the S&P 500® Index. U.S. bonds are represented by the Bloomberg U.S. Aggregate Bond Index. U.S. TIPS are represented by the Bloomberg U.S. TIPS Index. U.S. REITs are represented by the FTSE NAREIT All Equity REITs Index. Core inflation is measured by CPI.
Other assets, such as real estate, have a built-in resilience to inflation. Real estate investment trusts (REITs), for example, generate interest income from rents. They have the potential to increase in value because property costs and rents tend to rise over time and during inflationary periods.
Our favored strategy is to work with a financial professional to maintain a diversified investment portfolio. Assembling an asset mix attuned to your goals, risk tolerance and investment horizon may help preserve long-term purchasing power.
Why Some Inflation Layers Refuse to Peel Away
Unpeeling the layers of the inflation onion illustrates how the Fed dissects inflation and steers policy. Given today’s uncertainty surrounding tariffs, geopolitics and global trade, a resurgence in inflation remains a possibility.
In the meantime, ensuring that your investment portfolio is broadly diversified is likely a prudent strategy.
Authors
Associate Client Portfolio Manager
Stay Ahead of Inflation
Visit our inflation hub to learn more about inflation-hedging strategies.
John C. Williams, “Peeling the Inflation Onion, Revisited,” Virtual Remarks Prepared for a Regional Visit to Long Island, September 29, 2023, Bank for International Settlements (BIS).
Owner’s equivalent rent represents the estimated amount a homeowner would pay to rent their current residence or the rental income they forgo by occupying their own home rather than renting it; Chair Jerome H. Powell, Speech on Inflation and the Labor Market at the Brookings Institution, Board of Governors of the Federal Reserve System, November 30, 2022.
Martin Almuzara, Marek Jarocinski, and Argia Shordone, “The Layers of Inflation Persistence,” Liberty Street Economics, Federal Reserve Bank of New York, January 5, 2023.
U.S. Bureau of Labor Statistics.
Christopher J. Neely, “Measuring Inflation: Headline, Core and ‘Supercore’ Services,” Federal Reserve Bank of St. Louis, May 3, 2024.
Investment return and principal value of security investments will fluctuate. The value at the time of redemption may be more or less than the original cost. Past performance is no guarantee of future results.
The opinions expressed are those of American Century Investments (or the portfolio manager) and are no guarantee of the future performance of any American Century Investments portfolio. This material has been prepared for educational purposes only. It is not intended to provide, and should not be relied upon for, investment, accounting, legal or tax advice.
Generally, as interest rates rise, the value of the bonds held in the fund will decline. The opposite is true when interest rates decline.
Diversification does not assure a profit nor does it protect against loss of principal.